


Weekly Technical Trade Levels on USD Majors, Commodities & Stocks
- Technical trade setups we are tracking into the weekly open
- Next Weekly Strategy Webinar: Monday, September 2 at 8:30am EST
- Review the latest Video Updates or Stream Live on my YouTube playlist.
In this webinar we take an in-depth look at the technical trade levels for the US Dollar (DXY), Euro (EUR/USD), British Pound (GBP/USD), Australian Dollar (AUD/USD), Canadian Dollar (USD/CAD), Japanese Yen (USD/JPY), Swiss Franc (USD/CHF), Gold (XAU/USD), Crude Oil (WTI), and Equity Indices. These are the levels that matter on the technical charts into the weekly open.
Japanese Yen Price Chart – USD/JPY 240min
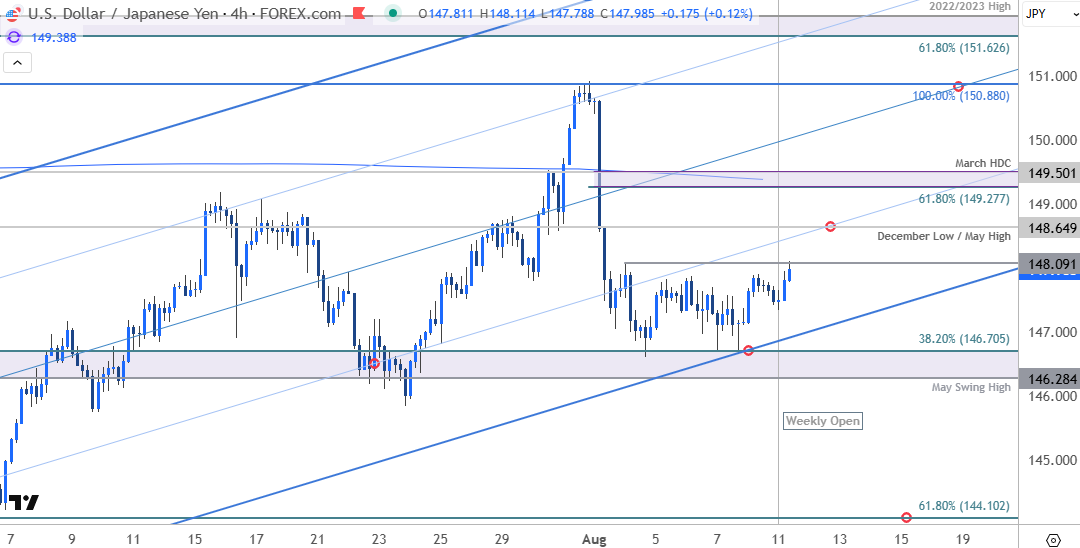
Chart Prepared by Michael Boutros, Sr. Technical Strategist; USD/JPY on TradingView
Last week’s opening-range never broke and the focus into the open is on a breakout of the 146.28-148.09 range for guidance. Note that USD/JPY rebounded off key support last week and keeps the outlook weighted to the topside while above the monthly low. Review my latest Japanese Yen Forecast for a closer look at the longer-term USD/JPY technical trade levels.
British Pound Price Chart – GBP/USD 240min
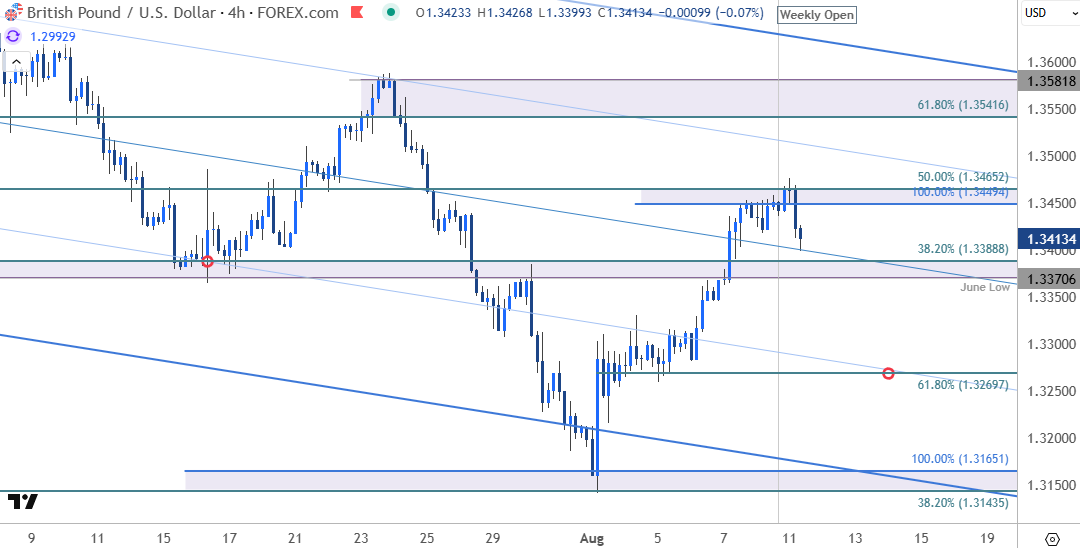
Chart Prepared by Michael Boutros, Sr. Technical Strategist; GBP/USD on TradingView
Sterling reacted to confluent resistance into the weekly open at the 50% retracement of the June decline / 100% extension of the August advance at 1.3449/65- the weekly opening-range is taking shape just below. Initial support rests with the June low / 38.2% retracement at 1.3370/88- losses below this level would threaten a larger setback towards the 61.8% retracement at 1.3270. Critical resistance steady at 1.3542/82. Review my latest Japanese Yen Forecast for a closer look at the longer-term USD/JPY technical trade levels.

Canadian Dollar Price Chart – USD/CAD 240min
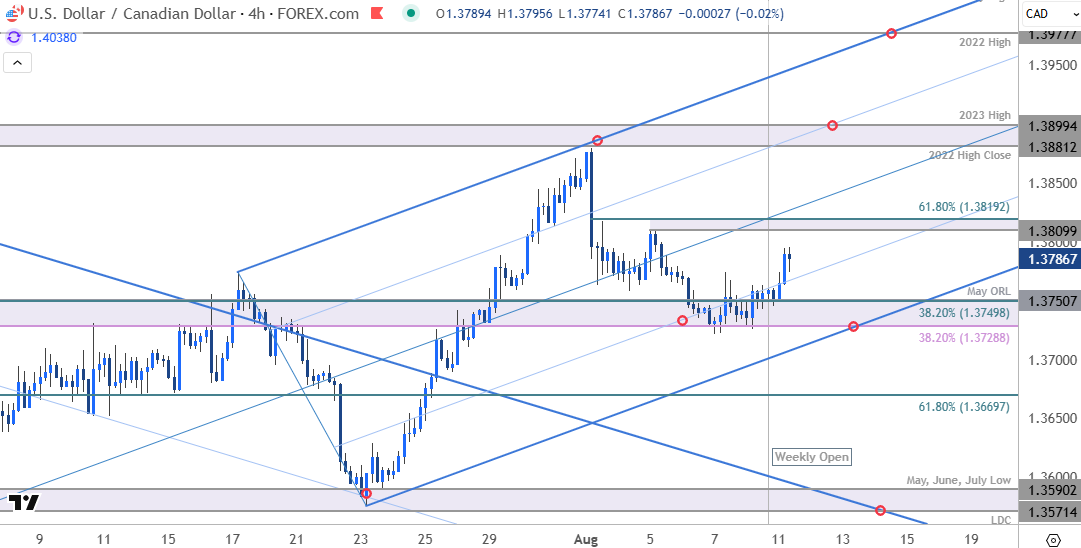
Chart Prepared by Michael Boutros, Sr. Technical Strategist; USD/CAD on TradingView
USD/CAD rebounded off a key inflection zone last week at 1.3729/49, with the weekly opening-range taking shape just above. Resistance stands at 1.3810/19 with a close above the median-line needed to fuel the next leg of the advance towards the 2022 high close / 2023 high at 1.3881/99. The outlook remains constructive while above the upper parallel with broader bullish invalidation at 1.3670. Review my latest USD/CAD Forecast for a closer look at the longer-term Canadian Dollar technical trade levels.
Economic Calendar – Key USD Data Releases
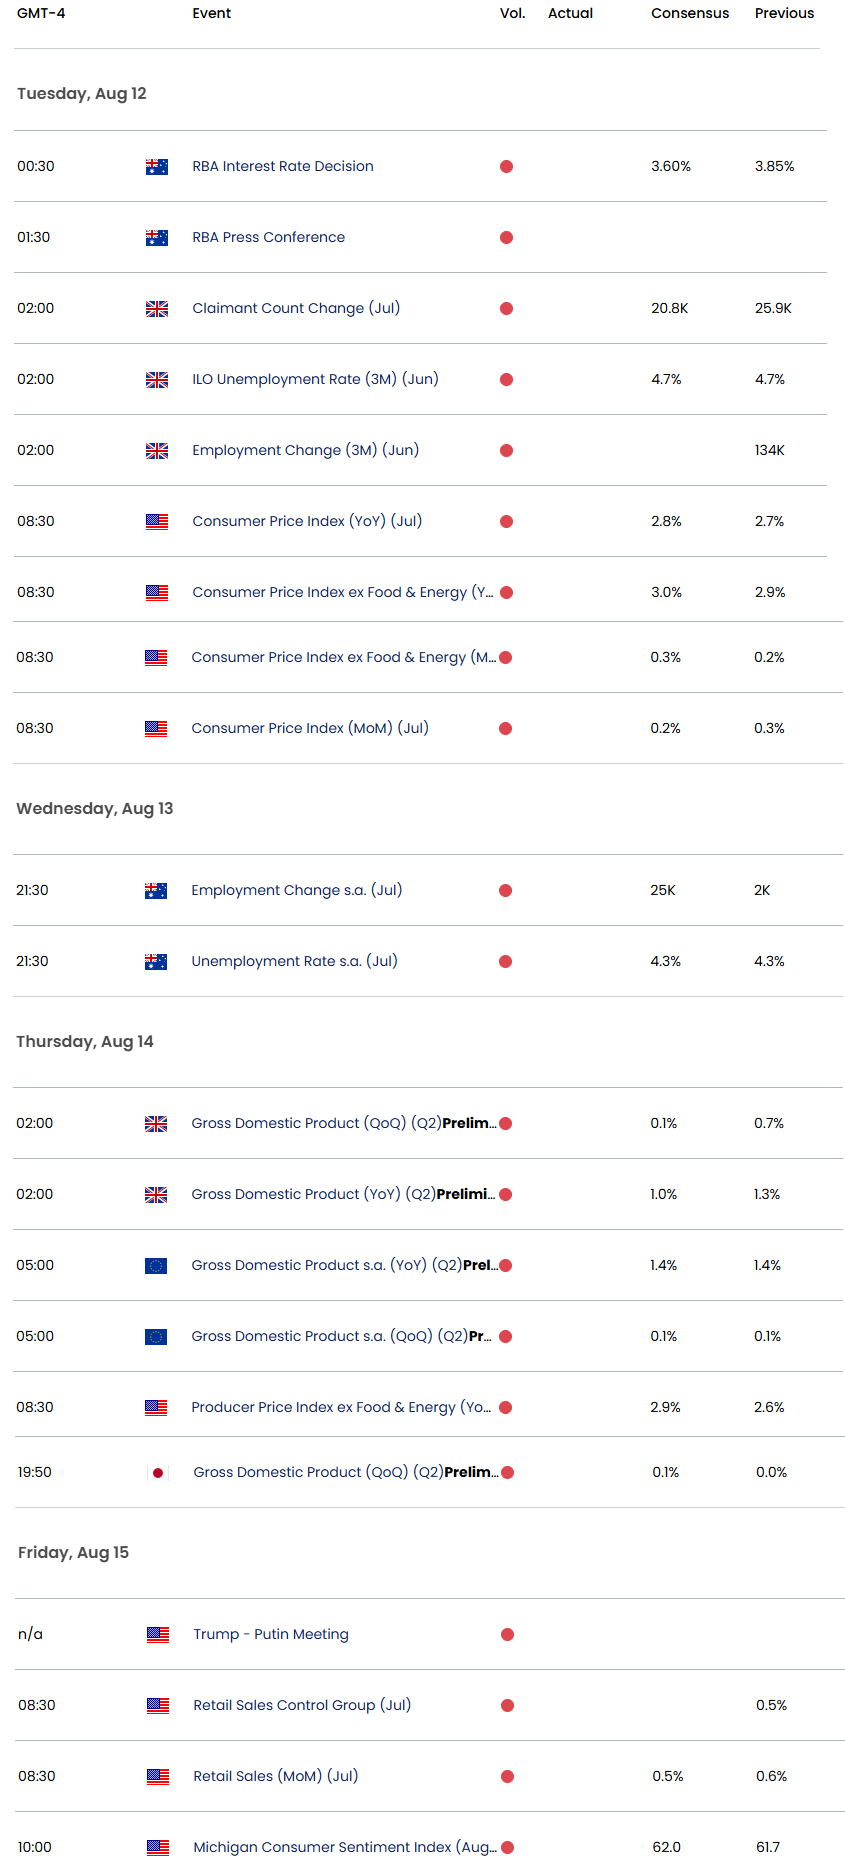
Economic Calendar - latest economic developments and upcoming event risk.
--- Written by Michael Boutros, Sr Technical Strategist
Follow Michael on X @MBForex






