If we go back to late-January there wasn’t exactly a positive economic backdrop around the Eurozone, and it wasn’t even all that bearish around the US and the USD. But a stunning sell-off in USD/JPY drove the US Dollar to its most oversold in five years and, in-turn, EUR/USD to deep overbought level as the pair tested above the 1.2000 handle.
That serves as illustration of just how impactful the unwind of that crowded carry trade in USD/JPY can be across the currency market. With USD selling taking hold on the back of a fast-moving USD/JPY sell-off, even EUR/USD can be buoyed higher like we saw in late-January. That’s not the only episode, however, as a similar backdrop showed in Q3 of 2024, when the Bank of Japan intervened to defend the Yen and sent the pair spiraling lower which, in-turn, drove a rally in EUR/USD up to fresh highs at the time around 1.1200.
As we go into next week USD/JPY is back above the 160.00 handle and this brings on fears around the possibility of another intervention. If we see the pair continue with bullish momentum, we may soon find ourselves in a spot similar to 2022, when the BoJ was forced into action as USD/JPY simply jumped from one major big figure at 145.00 to another at 150.00.
And if we do see the BoJ act, that Dollar weakness can play through with strength in the EUR/USD pair. And that may actually be a more attractive way tow ork with USD-weakness rather than trying to chase a reversal in USD/JPY.
From shorter-term EUR/USD charts there’s still a claim that bulls can hold on to as there’s been a hold of higher-lows. As of this writing, the 1.1500 level is back in-play and this bears some resemblance to last November, when 1.1500 was the spot where selling pressure started to slow and bulls, slowly, made their way back into the market.
EUR/USD Four-Hour Price Chart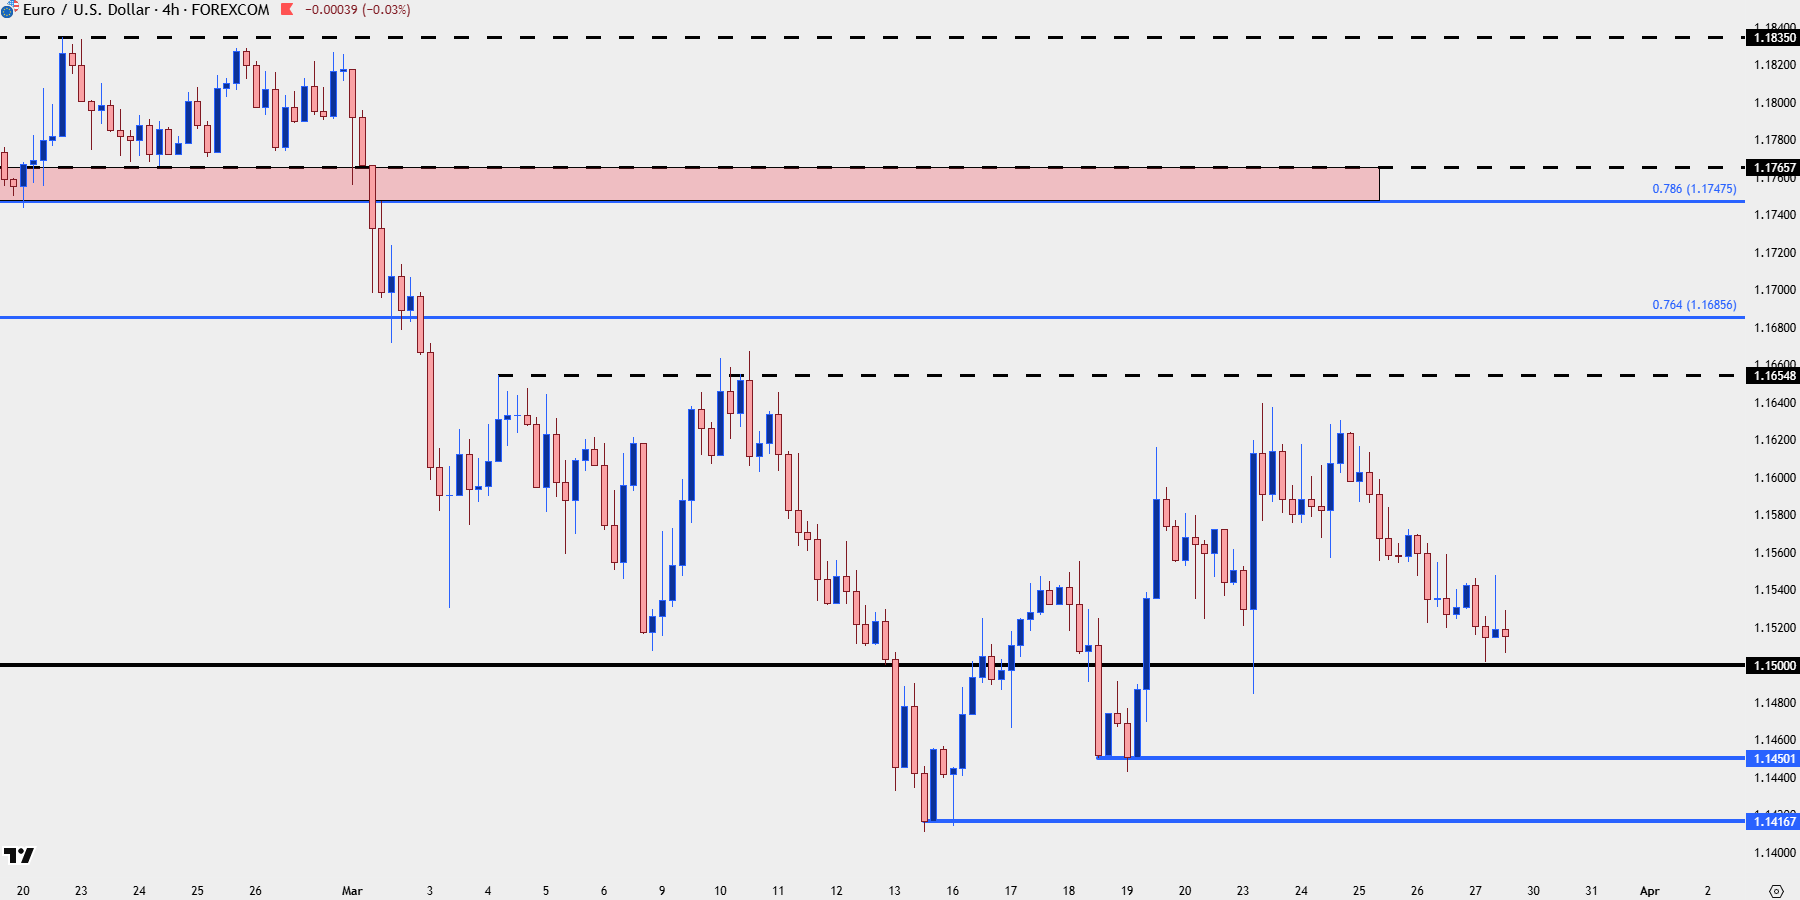
Chart prepared by James Stanley; data derived from Tradingview
EUR/JPY Bull Pennant
If looking for Yen-weakness to continue, that EUR/JPY backdrop is still attractive and the pair is going into the weekly close with a topside breakout from a bull pennant formation.
Bull pennants are often tracked as continuation patterns in upside trends, looking for periods of digestion that build symmetrical triangle formations such as we’ve seen over the past couple of months. The next major level sitting overhead is 185.00, and if looking for the BoJ to take a step back from intervention this may present a more attractive backdrop to work with than USD/JPY, considering the possibility of jagged moves on both sides of the major pair.
EUR/JPY Daily Price Chart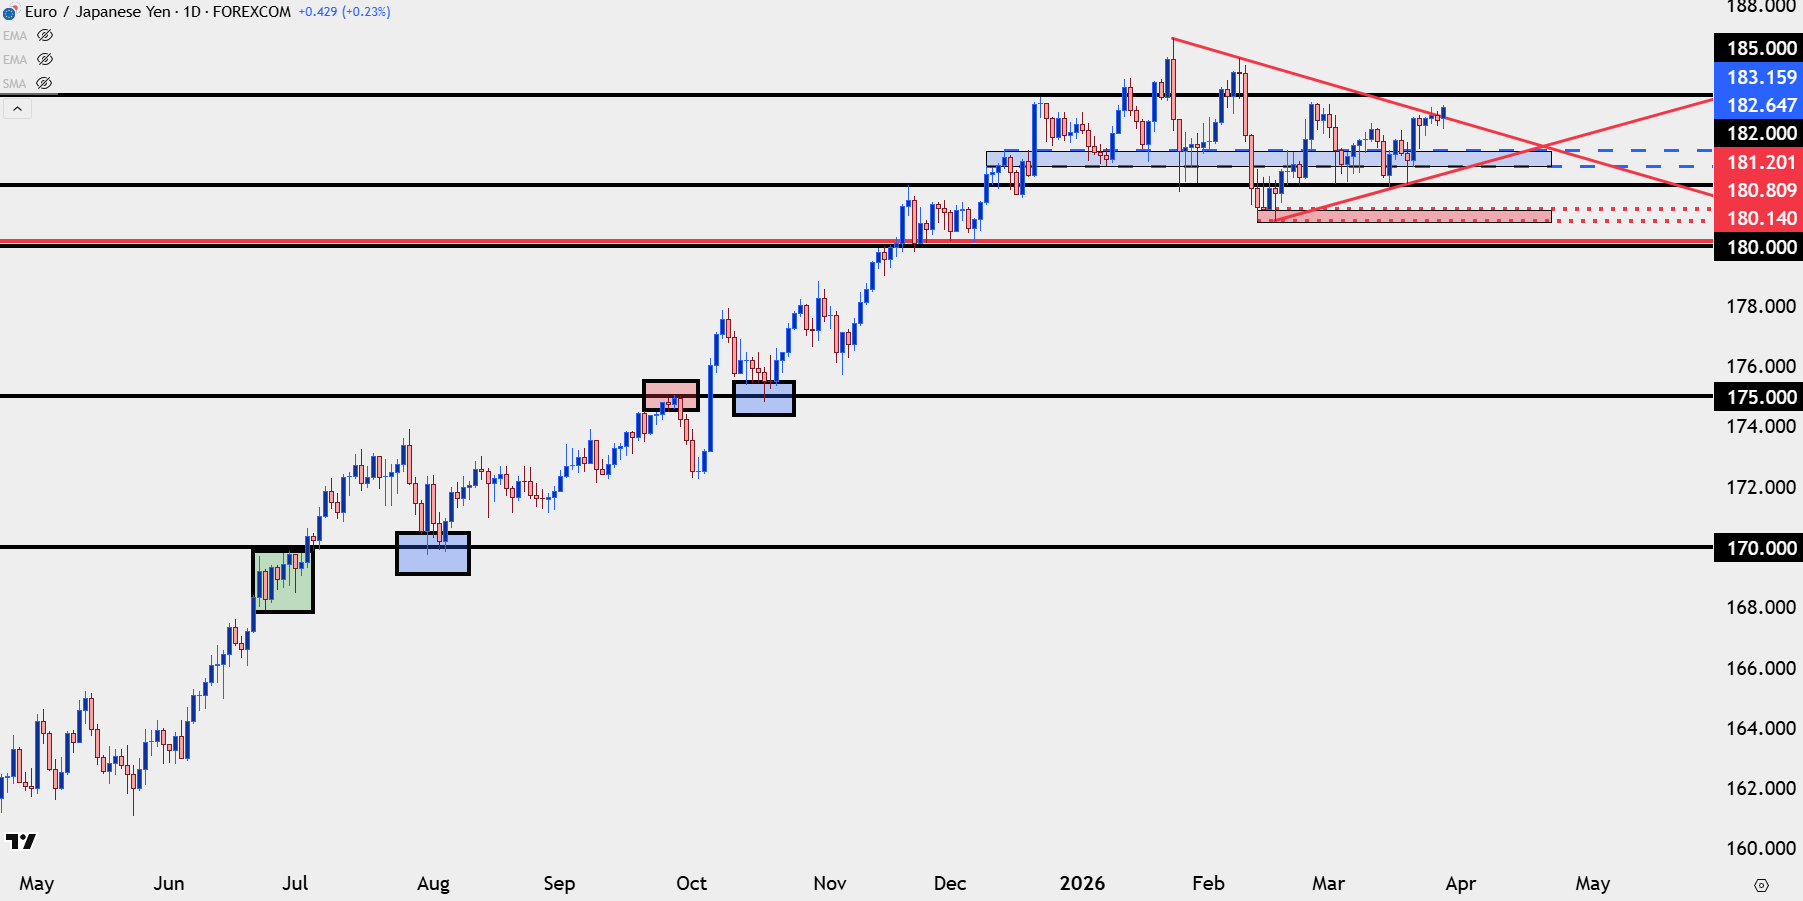
Chart prepared by James Stanley; data derived from Tradingview
EUR/GBP
I’m including the EUR/GBP pair for those that might want to try to avoid the expected volatility around USD and JPY pairs into next week. The past two weeks in EUR/GBP have been spent holding at 0.8625 and that’s a familiar support level, drawing images of mean reversion since the second half open last year.
Into the weekly close there’s a hold of resistance around 0.8680, and overhead there’s next resistance from 0.8739 up to 0.8753.
EUR/GBP Daily Price Chart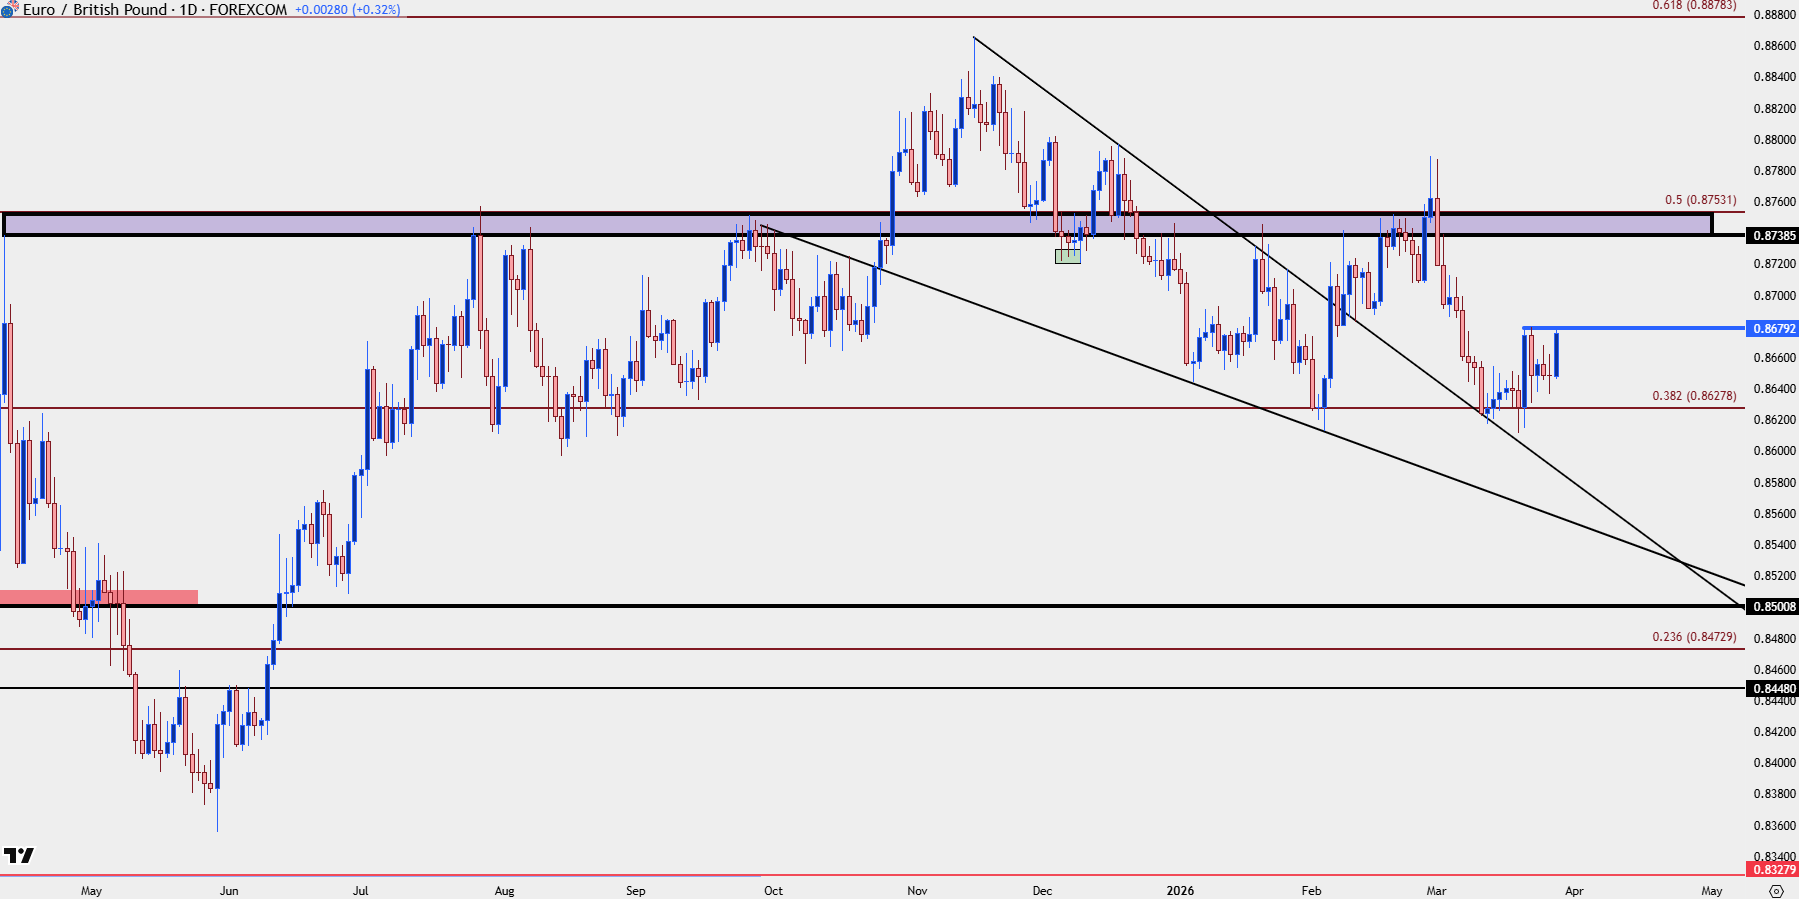
Chart prepared by James Stanley; data derived from Tradingview
--- written by James Stanley, Senior Market Analyst, Global Macro