
The EUR/USD has already accumulated a steady depreciation of over 1%, and is now trading close to the 1.16000 level—as a new bearish bias has taken hold—temporarily benefiting the U.S. dollar. So far, the downward pressure on the euro has remained consistent, driven by the revival of the trade war and the ongoing divergence in monetary policies between the two regions. These events have been key in the euro’s current weakness and could continue to be relevant sources of selling pressure on the EUR/USD in the short term.

Is the Trade War a Factor?
Regarding the escalation of the trade war, it’s important to note that on July 12, the U.S. administration announced its intention to impose a 30% tariff on all products coming from the European Union, with a tentative start date of August 1 this year. The decision has not been well received by European governments, who have already proposed countermeasures against the United States, targeting goods such as milk and pharmaceuticals. Furthermore, Europe has stated it will also implement these new tariffs starting August 1, should a formal agreement not be reached in the coming weeks.
While this move is currently seen as a negotiation tactic from the White House, some have warned that the decision could have a negative economic impact on Europe’s development. There have even been claims that if the tariffs go into effect, they could cancel out economic growth in countries like Germany, causing a significant slowdown by the end of 2025.
In this context, the latest escalation of trade tensions, now directly targeting several European countries, has not helped maintain investor confidence in the euro in the short term. This is mainly due to the steady outflow of capital from investors trying to hedge against a potential economic downturn in Europe. The euro has proven to be highly sensitive whenever the focus of the trade war shifts toward its territory, allowing the U.S. dollar to gain ground in the short term. If the trade conflict continues to escalate in the coming days, it is likely that confidence in the euro will fall further, fueling continued selling pressure in EUR/USD price action.
The Role of Central Banks
It is important to highlight that, as of now, the U.S. Federal Reserve maintains an interest rate of 4.5%, while in Europe, the current rate remains at 2.15%. What’s particularly notable is that while the Fed has adopted a neutral, steady stance, the European Central Bank has maintained a low-rate strategy as part of its expansionary plan to support economic growth. This divergence in monetary policy has been evident throughout the year, positioning the United States as the country with the highest interest rates in the short term.
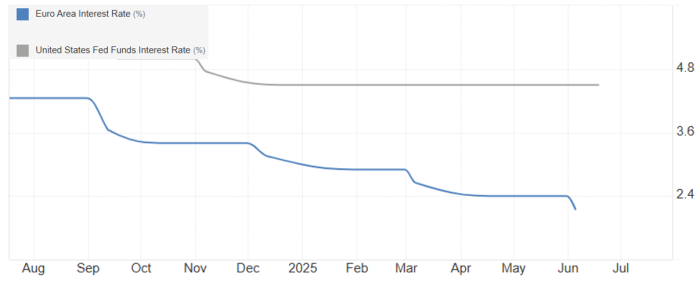
Source: Trading Economics
Given this scenario, higher interest rates in the U.S. are likely to continue attracting capital, as returns on dollar-denominated assets become more appealing compared to those denominated in euros. If this relationship remains steady, the continued inflow of capital to the U.S. seeking better yields could strengthen dollar demand and keep euro demand subdued. If these factors persist, they could become a relevant catalyst reinforcing selling pressure on the EUR/USD.
EUR/USD Technical Outlook
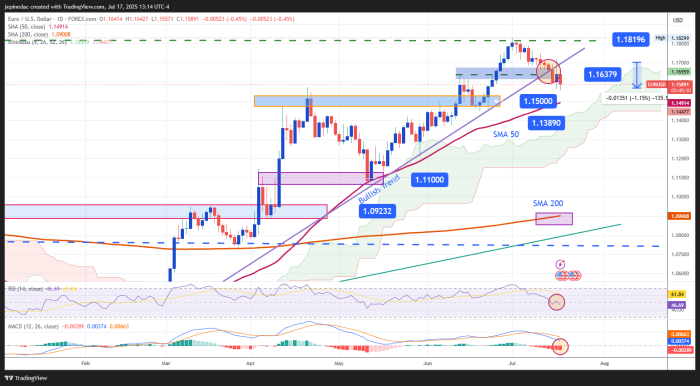
Source: StoneX, Tradingview
- Break of bullish trend: The bullish trend that had held during the last several weeks of trading has come under threat from a growing bearish movement that has started to take shape in the short term. For now, the selling pressure has been strong enough to break the trendline in recent sessions, which could add weight to a new bearish bias in the coming days. However, it is also important to note that the candlesticks from the last two sessions have shown persistent indecision, suggesting that this recent breakout could also give way to a more prolonged period of neutrality in the short term.
- RSI: The RSI line has started to show a steady downward slope and has already fallen below the neutral 50 level. As the line continues to move away from that zone, it is likely that bearish momentum will grow stronger.
- MACD: The MACD histogram has been showing consistent movement below the zero line in the short term. This indicates that the average strength of recent moving averages has been predominantly bearish. For now, there are no clear signs of reversal, so it’s important to note that short-term momentum remains firmly in bearish territory.
Key Levels:
- 1.18196 – Distant Resistance: This level represents the highest point reached this year and could once again serve as a barrier to major bullish moves. If buying pressure pushes through this level, the previous uptrend that had persisted for several months could be reactivated.
- 1.16379 – Nearby Barrier: This resistance is located near the zone that previously marked the uptrend line and could serve as a key level if upward corrections occur in the short term.
- 1.15000 – Psychological Support: Formerly a resistance, this level now stands as the most important support on the chart, aligned with a round number threshold. If price action consistently breaks below this zone, it could trigger the start of a new downward trend in the coming sessions.
Written by Julian Pineda, CFA – Market Analyst
Follow him: @julianpineda25