
- U.S.-UK rate spreads driving GBP/USD lower
- Key support levels broken, trend shift underway
- UK CPI may decide if selling intensifies
GBP/USD Summary
Interest rate differentials are moving in favour of the United States relative to the United Kingdom, weighing on GBP/USD and placing increased emphasis on Wednesday’s U.K. inflation report when it comes to near-term directional risks. Having taken out key technical levels over recent days, a softer-than-expected outcome may cement the trend change.
Interest Rate Differentials Bolster USD
Source: TradingView
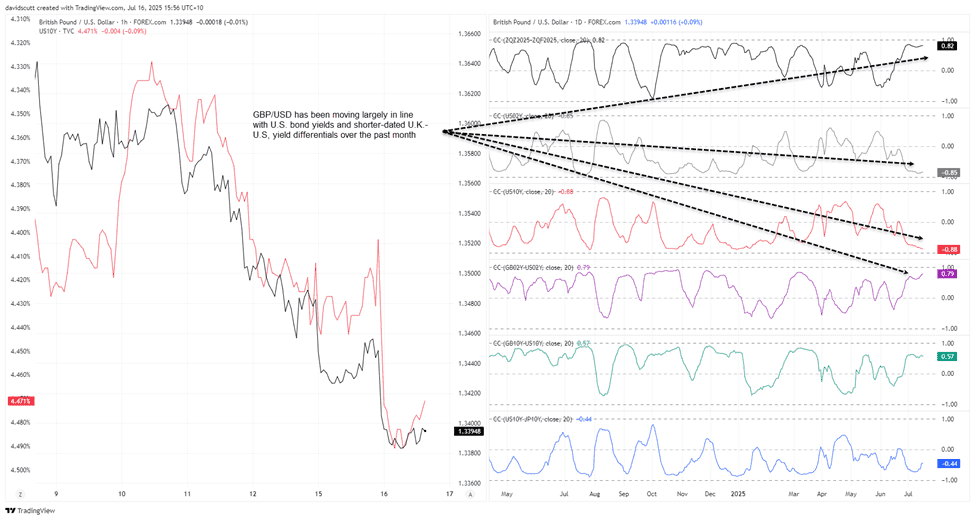
The first chart shows the rolling 20-day correlation coefficient between GBP/USD and a variety of financial and market indicators, providing a guide to which relationships have been strengthening over the past month.
The score with 2025 Fed rate cut pricing stands at 0.82, indicating a strong, positive relationship between the two variables. There’s been an even stronger inverse correlation with U.S. two and 10-year Treasury yields over the same period at -0.85 and -0.88 respectively. While that suggests the shifting U.S. interest rate outlook has likely contributed to recent weakness in GBP/USD, it’s noteworthy the correlation with shorter-dated yield differentials between the U.K. and U.S. has been nearly as strong at 0.79, with the relationship nearly perfect over the past week.
That means Wednesday’s U.K. inflation report looms as a potential key market driver, especially with GBP/USD taking out several important technical levels in recent days.
GBP/USD Trend Change Underway?

Source: TradingView
First it was the 50-day moving average, a level the price had bounced from on the previous two occasions it was tested. That break likely contributed to the price action seen this week, with Cable slicing through the January 2025 uptrend, warning of a potential trend change. After failing to reclaim the uptrend, we’ve now seen the price slide beneath 1.3400—a level that previously offered support.
With RSI (14) trending lower and MACD confirming the bearish momentum signal by sinking into negative territory, a soft U.K. inflation report may spark an accelerated move lower, especially if the June 23 low around 1.3370 is taken out. There’s not a lot of technical support to speak of until 1.3250 and 1.3142. A make-or-break moment comes to mind.
If the data comes in hot, look for a potential retest of the January uptrend. If the price can clear that hurdle, it would put the 50-day moving average and former horizontal support at 1.3530 on the radar for longs.
The key core inflation figure is expected to print at 0.2% in June and 3.5% over the year, unchanged from the levels reported in May. Services inflation is seen easing to an annual clip of 4.5%, down from 4.7%. To keep the prospect of further rate cuts from the BoE alive without an ugly downturn in the labour market, it’s important the disinflationary trend in services prices continues. Headline inflation is forecast to rise 0.1%, leaving the annual rate steady at 3.4%, still well above the BoE’s mandated 2% target.