Gold prices are grasping to hold support at the $5k level and I looked at this in close detail during yesterday’s webinar, getting down to the one-minute chart to monitor how buyers could defend that price which has so far held. As I looked at last week, the bigger picture bullish bias in gold very much remains in-place but what is more of a question is whether the current bout of consolidation is ready to yield to trend.
In past periods of consolidation, we’ve had two months at the end of 2024 or four months in the middle of last year – both periods when markets were debating future Fed policy direction. It seems we’re in a similar fundamental backdrop at the moment where markets are expecting rate cuts later in the year but US data hasn’t been all that bad, thus removing some of the impetus for cutting sooner rather than later.
We can get a good picture of this from the weekly chart, where a long upper wick two weeks ago was countered by a long underside wick last week, showing a bullish response to the sell-off that has so far continued through this week’s trade.
But there’s also three prior episodes of consolidation marked over the past year and a half and this highlights how there could be more continued jostling before buyers are ready to ultimately take out that prior swing-high at the $5600 level.
Gold Weekly Chart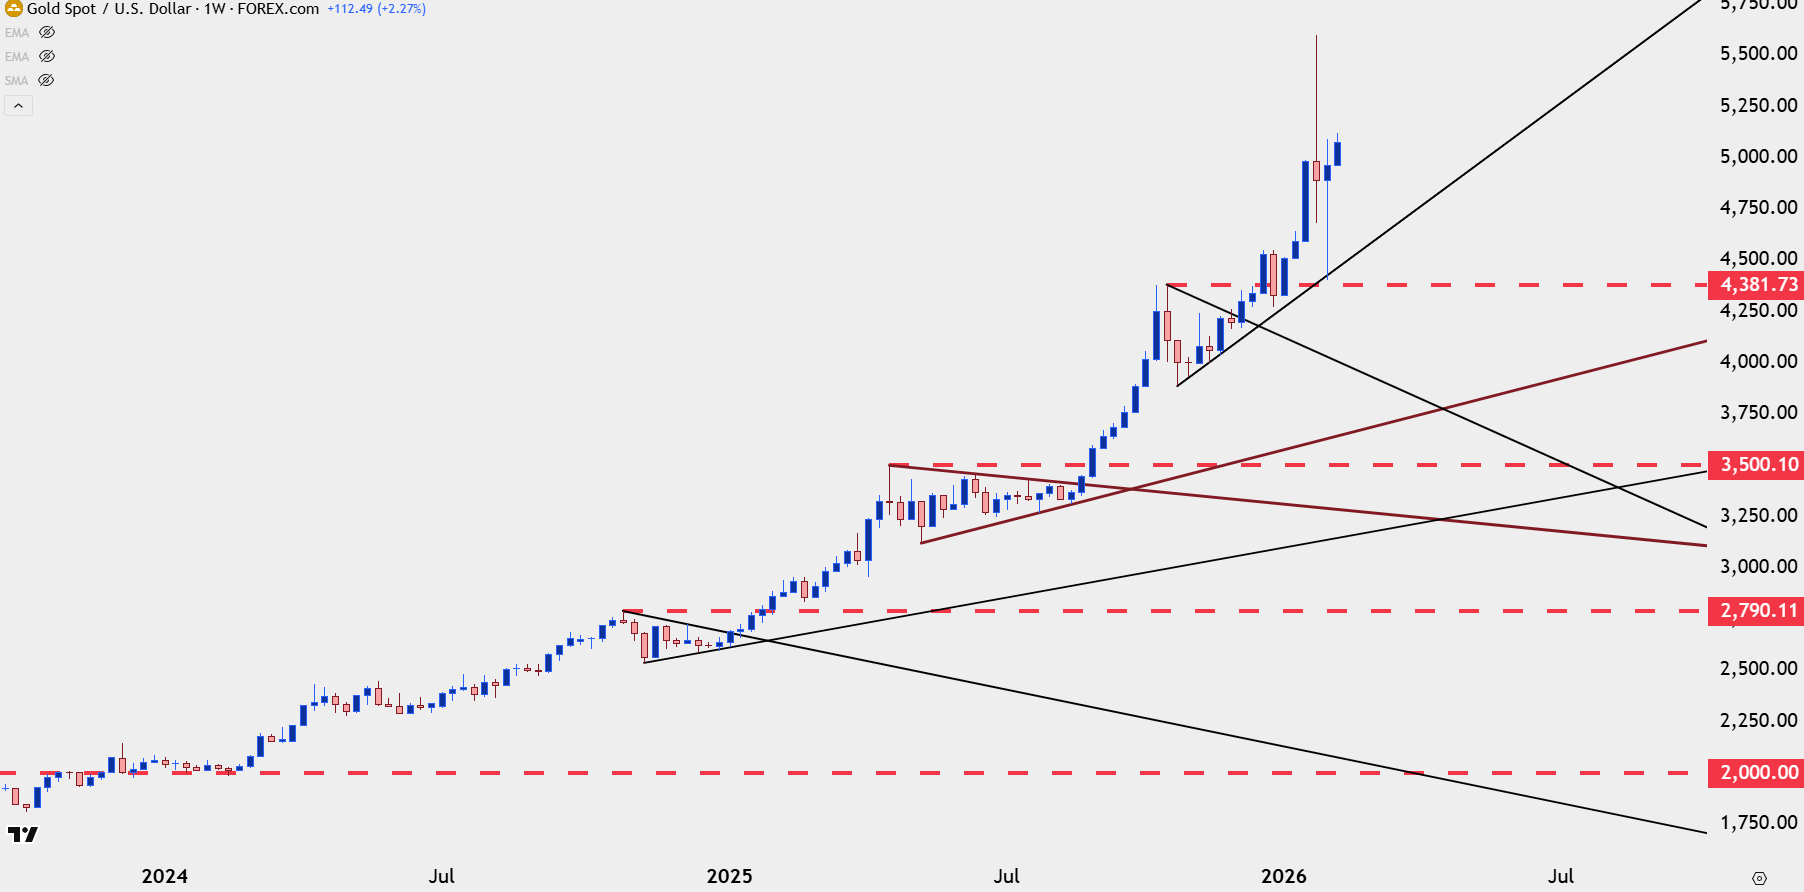
Chart prepared by James Stanley; data derived from Tradingview
Gold Daily
The daily chart at this point retains a bullish bias as there’s higher-lows to go along with horizontal resistance around the $5100 level. This isn’t quite clean enough for me to consider it as an ascending triangle but there’s certainly a similar tonality there as each recurrent hit of horizontal resistance has led to a higher-low. This keeps the door open for breakouts as we move towards the end of the week but caution should be exercised on chasing breakouts, as we’re heading for a holiday weekend in the United States. Given the propensity for profit taking into that holiday weekend there’s a heightened possibility of pullback.
Gold Daily Chart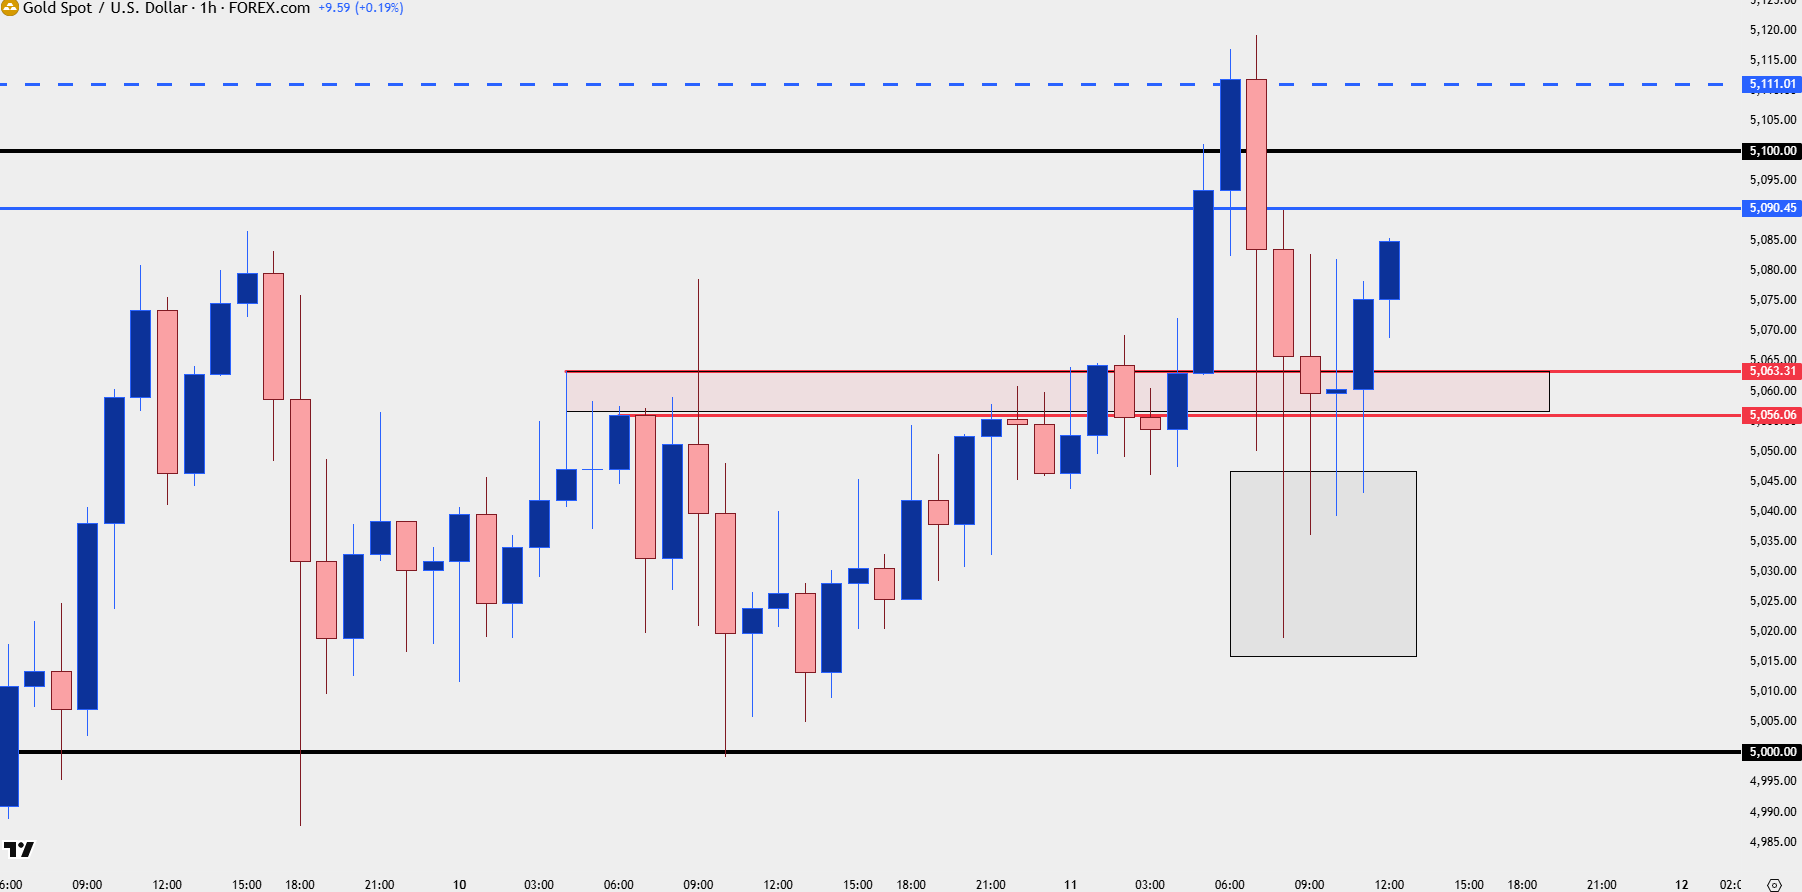
Chart prepared by James Stanley; data derived from Tradingview
Gold on the Levels
I’ve been highlighting this in more detail than usual of late as gold price action has shown adherence to round psychological levels, evidenced by both the swing high at $5600 and the recent build of resistance at $5100. Again I looked at this in-depth during yesterday’s webinar with careful focus on the $5k level, along with how this can be used and tracked on shorter time frames.
Until the market gives me reason to change I’m going to continue to look for inflections at these levels, with $5k the spot that buyers need to defend to retain control. A break of that cautious from bullish continuation while a break of $5100 opens the door for $5200 and $5250.
Gold Hourly Price Chart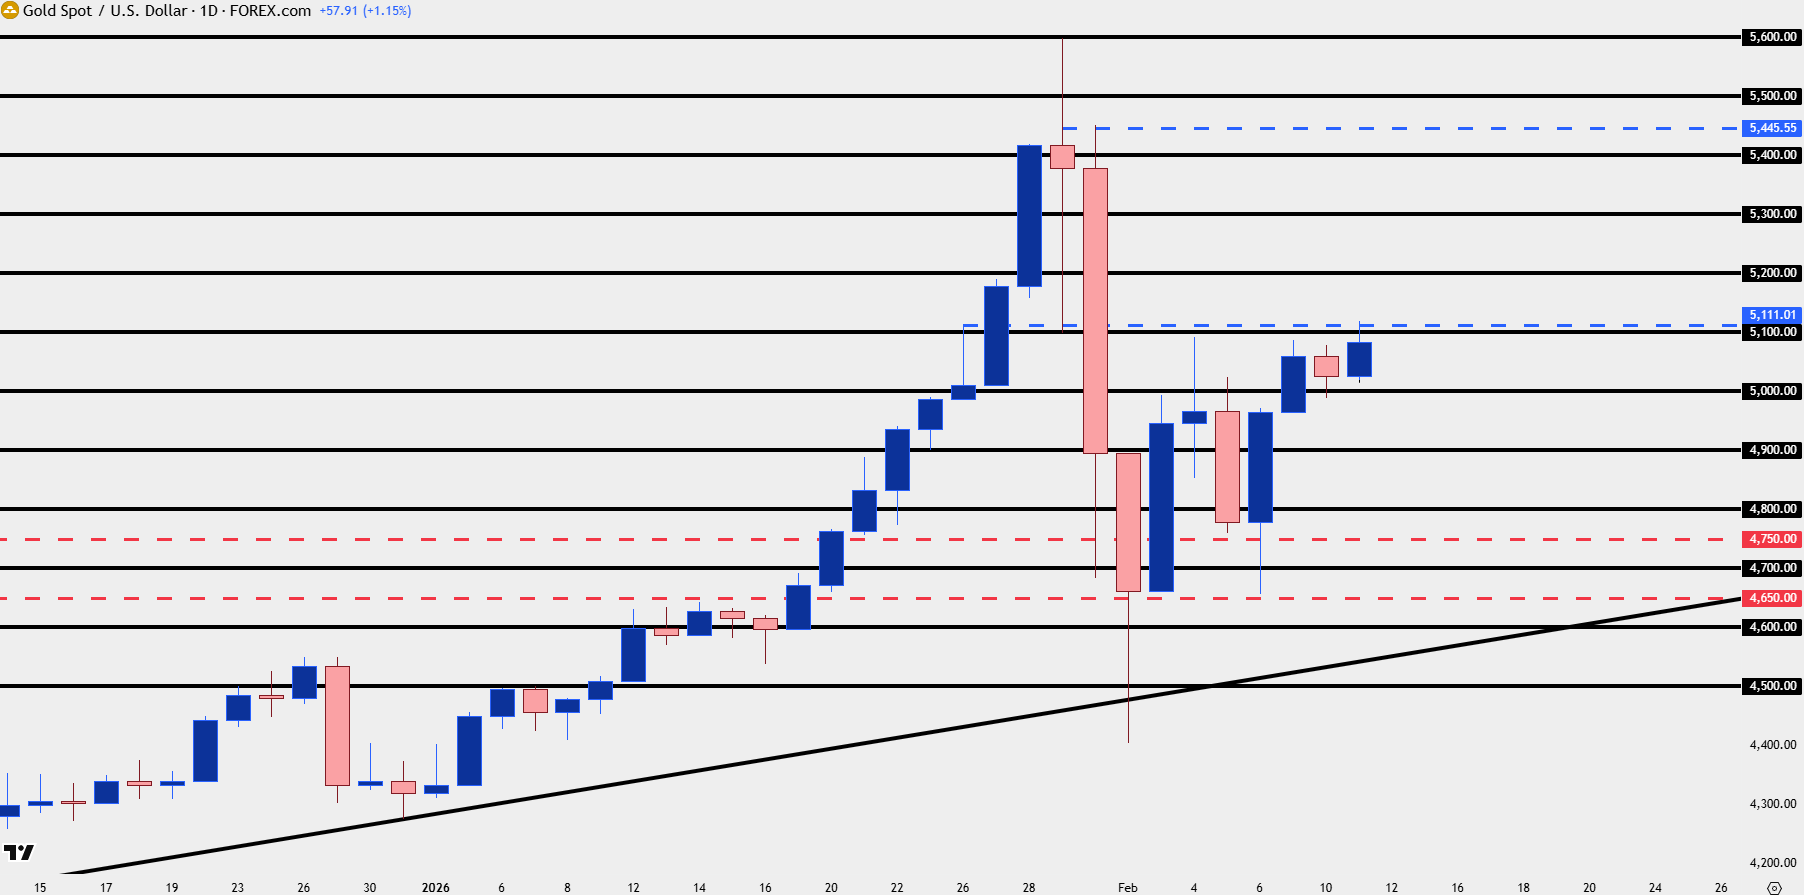
Chart prepared by James Stanley; data derived from Tradingview
--- written by James Stanley, Senior Market Analyst, Global Macro