The weekly bar in gold leading into last week looked threatening and imposing. The upper wick alone was more than $600 and it was a sound rebuke of the $5k level as buyers were trampled by a late-week sell-off. For the first time in months, sellers had an open door as they came into last week’s open and while they were able to run price down for a test of $4500, their control didn’t last for long, and bulls made a strong re-entry to the situation to push back up towards that same $5k level, which remains a massive spot of important for trends in the metal.
Gold Weekly Price Chart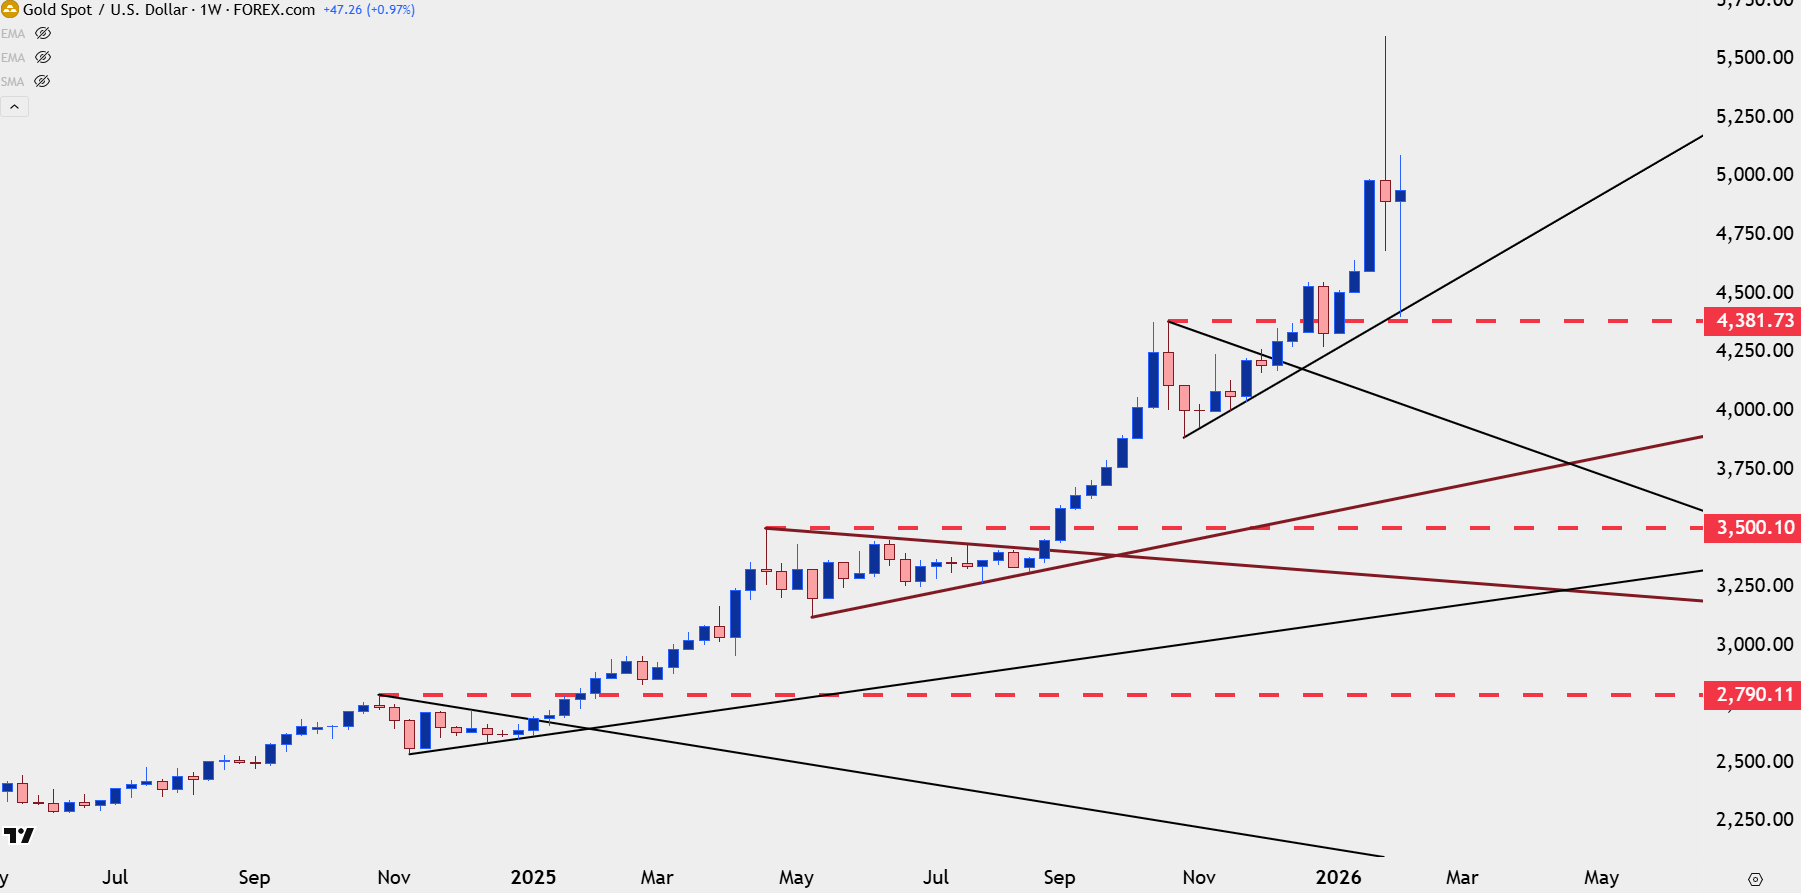
Chart prepared by James Stanley; data derived from Tradingview
With the weekly chart above we have to at least open to the possibility of continued consolidation. After all, gold prices did make a strong leap from the last bull pennant formation and when such a one-sided move shows up, there’s often motive for profit taking which can create those digestion setups. This is similar to what showed in the final two months of 2024 or from April through August of last year, and then again ahead of last year’s close.
It's still too early to forecast a prolonged period of consolidation, however, but this could be enough to continue to provide motive for biasing the long side of the matter, looking for pullbacks and support tests to open the door for the possibility of bullish continuation.
The daily chart below highlights uncertainty as the bulk of the past week was a grinding range between $4700 and $5k.
Gold Daily Chart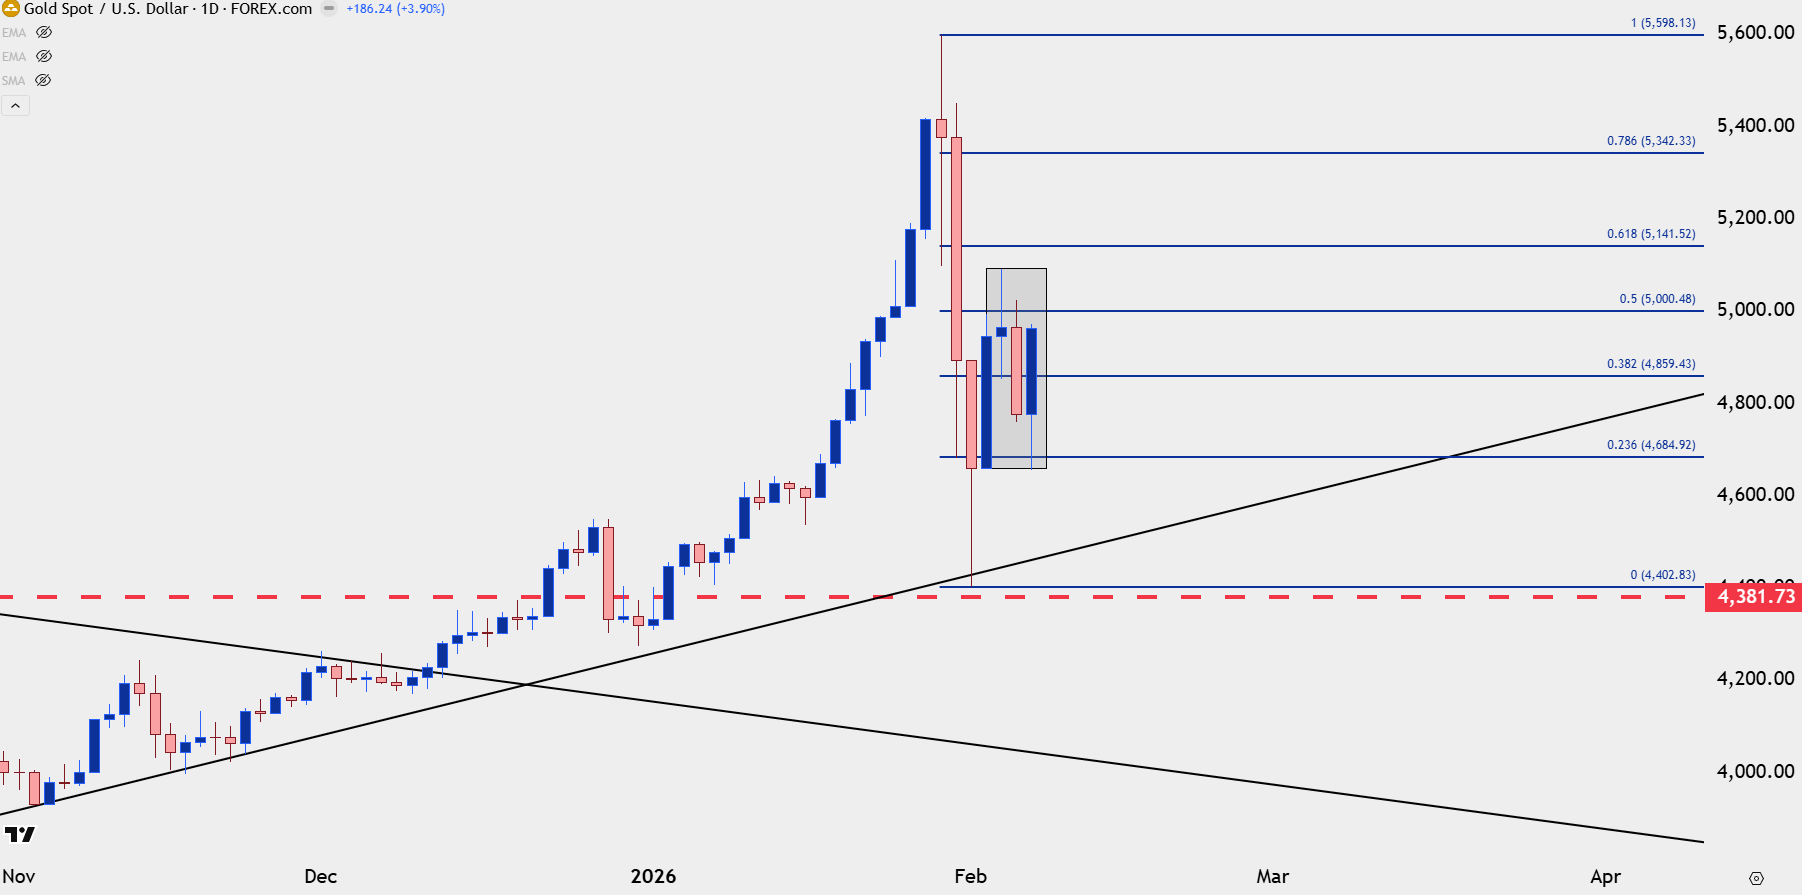
Chart prepared by James Stanley; data derived from Tradingview
Gold Strategy at Psych Levels
Interestingly with the high cutting right at $5600 there’s been a clear illustration of round numbers playing a big role in price inflections, and that played out on a shorter-term basis, as well.
The spilling sell-off into last week’s open ran all the way down to $4500, which saw a pivot over a three hour period until bulls were able to take over. That was followed by a bounce up to $4800 and then a higher-low at $4600, and then another at $4750 and $4900 before ultimately a test above $5k that stalled just inside of $5100.
And then as sellers went on the attack, it was $4900 and $4800 that marked swing lows until a lower-high printed at $4900 and then a lower low – and another pivot – at $4700.
There was one more dose of resistance at $4900 into the end of the week with bulls ultimately taking that out but unable to drive above the major psychological level at $5k.
For next week, I want to continue to look for inflections off of round numbers and there’s also the possibility of adopting a bullish bias based on the prior prevailing trend. But as the below chart shows, there have certainly been multiple inflection points print around these big figures of late.
Gold Hourly Chart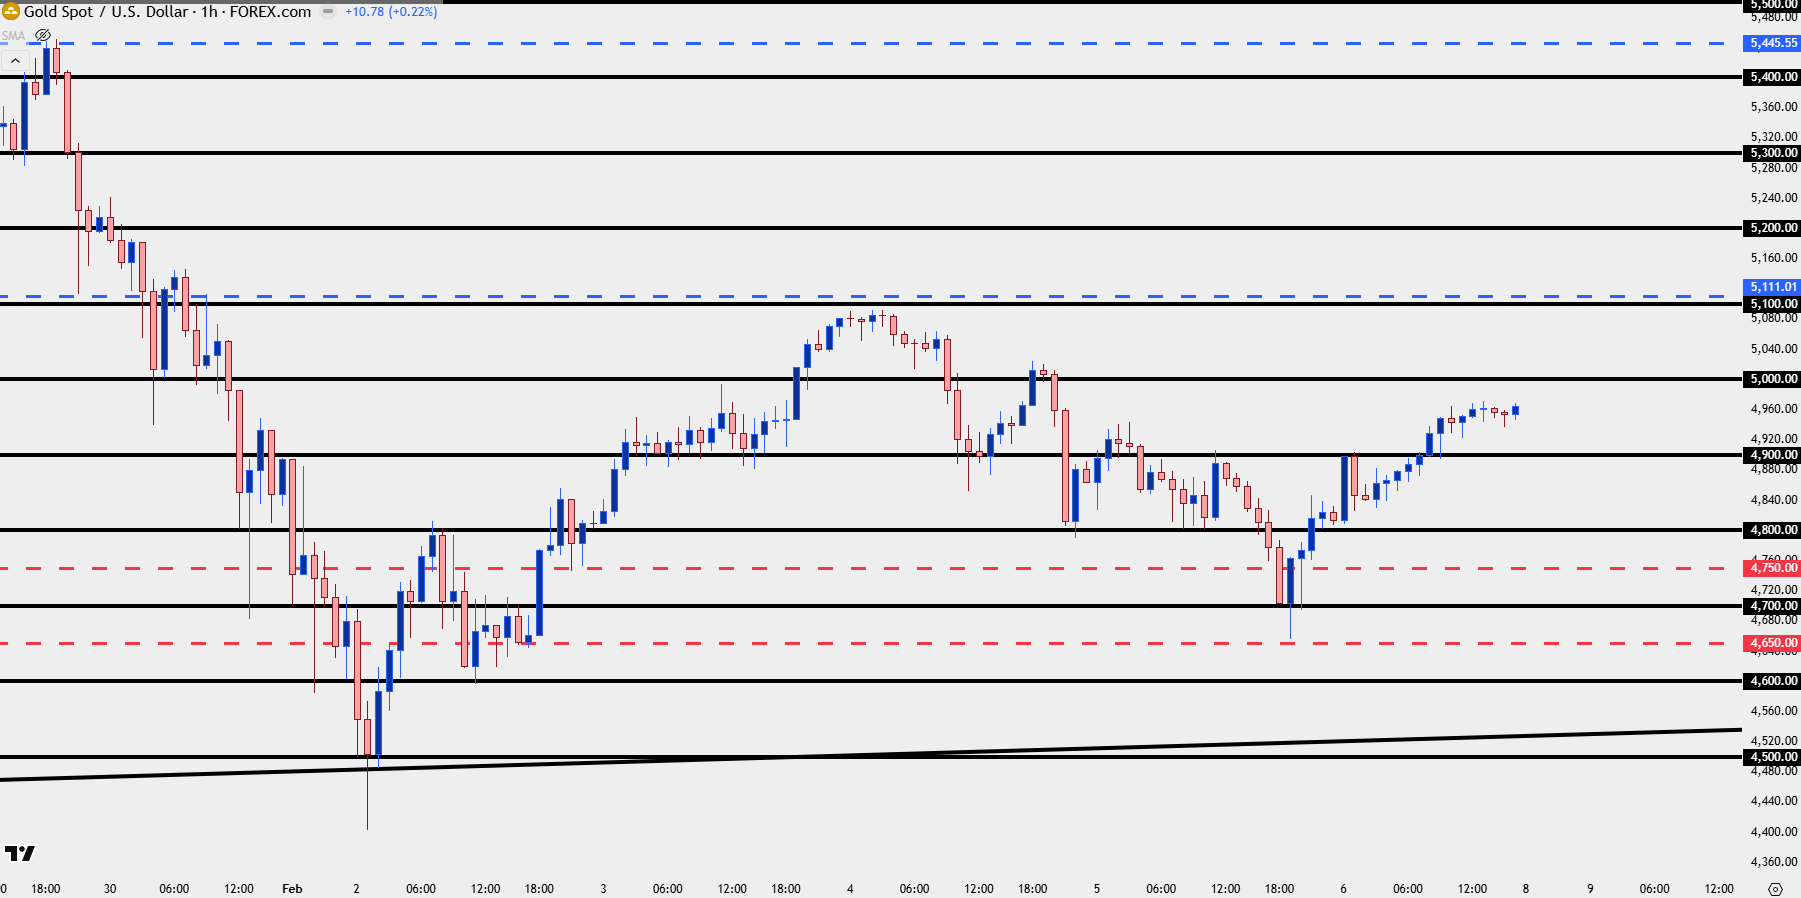
Chart prepared by James Stanley; data derived from Tradingview
--- written by James Stanley, Senior Market Analyst, Global Macro