
Gold Technical Outlook: XAU/USD Multi-Timeframe Analysis
Gold price technical analysis shows gold breaking out of its September downtrend after a 17.6% slide, as momentum divergence tests the rebound. Michael Boutros, StoneX Media Senior Market Analyst, walks through gold on the weekly, daily and four-hour charts, from the trendline break that fueled the decline to the Fibonacci retracements that frame the recovery. Gold fell in eight of the past 10 weeks after the August high, as the break of a three-point trendline accelerated the decline. Gold broke out of the descending channel that defined the September downtrend and pushed back above the 23.6% Fibonacci retracement. On the four-hour chart, price set a higher high that the momentum oscillator failed to confirm, a divergence that leaves room for a pullback. U.S. Consumer Price Index and Producer Price Index data add event risk, as strong nonfarm payrolls keep the Federal Reserve focused on inflation and Treasury yields in view.
This content was created by an affiliate of FOREX.com and represents the views and opinions of the author/speakers, not the views and opinions of Forex.com, StoneX Group Inc., or its subsidiaries. The content has not been independently reviewed by FOREX.com.

Key US Economic Data Releases
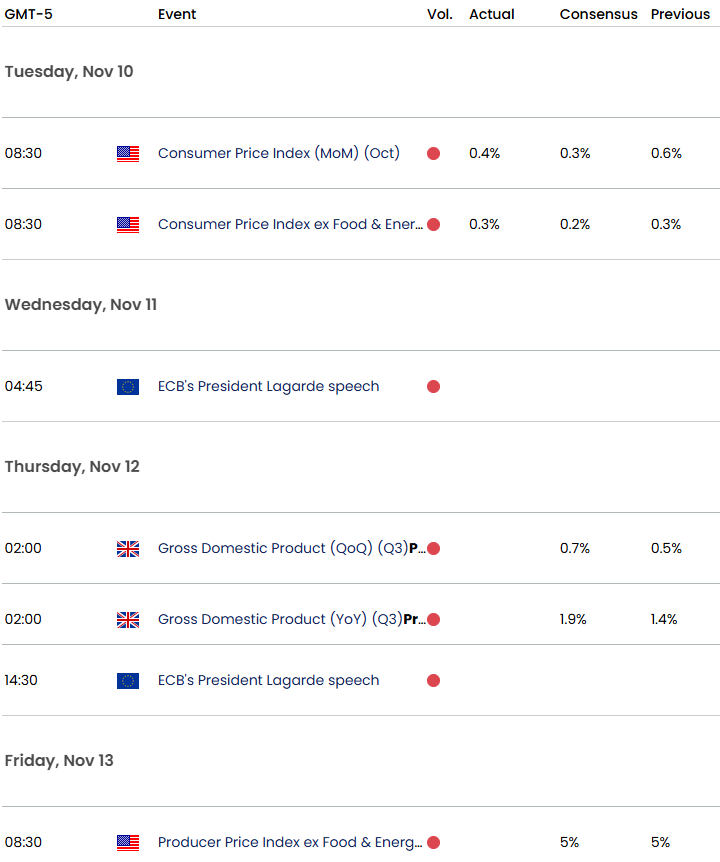
Economic Calendar - latest economic developments and upcoming event risk.
Active Short-term Technical Video Updates
- US Dollar Technical Outlook: DXY Bulls Fight to Hold Critical Support Ahead of NFP
- Euro Technical Outlook: EUR/USD Support Reversal Sets Up Breakout Test Ahead of NFP
- Australian Dollar Technical Outlook: AUD/USD October Breakout Reverses Toward Critical Support
- British Pound Technical Outlook: GBP/USD Reversal Threatens October Recovery
- Canadian Dollar Technical Outlook: USD/CAD Plunge Tests Critical Support Ahead of BoC, Fed
- Swiss Franc Technical Outlook: USD/CHF Reversal Puts Major Support in Focus
--- Written by Michael Boutros, Senior Technical Strategist
Follow Michael on X @MBForex