
Currencies are unique as an asset class and for many traders and quite a few investors, that nuance is difficult to explain. After all, the aim of trading currencies is the same as stocks or gold or palm oil or anything else: To use risk capital in an attempt to profit, and along the way taking risk that could erase some or all of that capital. But as far as the underlying assets go currencies are unique from those other markets in several ways, chief of which is the fact that all of those other markets are priced in the very same currencies that are being traded on FX platforms.
This is why spot FX is often traded in pairs: Because the only way to value a currency – is with another currency. So if you ask someone the value of the Euro there’s not an easy direct response, you then need to ask, ‘against which currency?’
Commonly in the FX world the default is the major pair, which is the pairing of the currency in question with the US Dollar. And in many ways the USD is the center of both the FX universe and western capitalism, which global trade often settled in the US currency. The USD is also considered as ‘the global reserve,’ and that title allows the US certain benefits, such as control over other countries and trade partners that can allow for leverage when levying sanctions.
This is somewhat controversial and far from the point of this article, but what is in the equation at the present is the USD’s role in the global economy, as for years it’s seemed that general policy was to avoid any direct engagement of strength or weakness drives even if other trade partners were doing so.
Japan is a key example, and this is something that former Treasury Secretary Janet Yellen had commented on without seeming to do anything about it. But with a backdrop of decades of deflation and disinflation and an aging population that’s only going to continue to decrease, Japan has been somewhat desperate to drive economic growth in their economies. This hit home in 2012, with the election of Shinzo Abe and his ‘Abe-nomics’ platform designed to put growth front-and-center for the Japanese economy. As part of the strategy there were multiple components, but a big part of that approach was weakening the Yen to help boost exports.
By doing so, the value of USD/JPY rose from the 80’s into the 120’s and, in essence, made it easier for Japanese companies to sell products in the United States. The other side of that, however, is that it made it more difficult for US companies to compete and if we’re looking at a market like automobiles, that can have an outsized impact on the economy in the United States.
For US policymakers it seemed that this was largely tolerated as assistance to a key trade partner. But since President Trump’s inauguration a year ago, this has been a major focal point as he’s attempted to get that dynamic reversed to help US companies. This drove a massive wave of USD-weakness in the first-half of last year and he’s been back on the topic with aggression even as the DXY sell-off stalled in the second-half.
US Dollar Daily Price Chart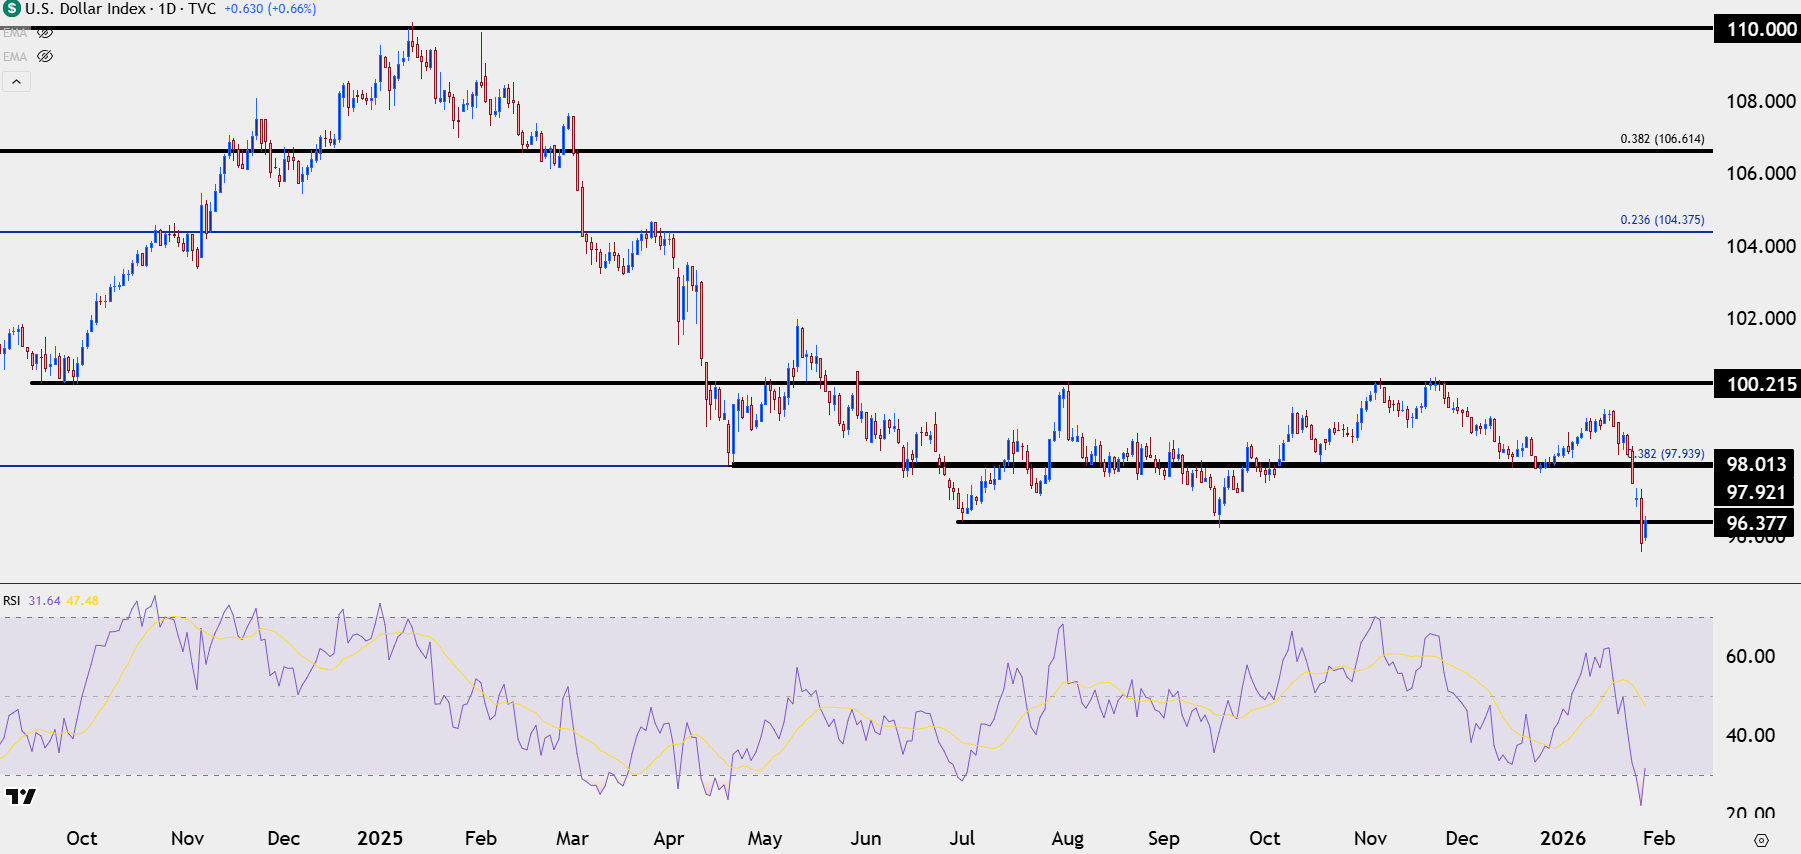
Chart prepared by James Stanley; data derived from Tradingview
USD: Where’s the Weakness Going to Come From?
Getting back to that unique element of FX and the fact that the only way you can value a currency – is with another currency, and there’s a conundrum of sorts. And it’s perhaps less obvious in the US Dollar basket or the DXY basket as it trades as a singular asset, similar to gold or stocks or anything else. But – the DXY basket is really just a basket of underlying currencies – so if we are going to see a trend in either direction for the Dollar, it’s going to need assistance from the currencies in that basket.

The Euro is the largest component at 57.6%, so many times when we see a USD trend there’s a mirror image trend in the Euro. The Japanese Yen is the second largest component at 13.6%, so when we see something like what happened in 2012 or again in 2021-2022, when the Japanese Central Bank keeps rates uber-low in effort of driving economic growth, well, that’s going to contribute to US Dollar strength just by nature of math.
And if we look at the US Dollar’s trend, or lack thereof over the past seven months, this can be drawn back to a surging USD/JPY as Yen-weakness has driven a large component of strength in the Dollar basket, even as the USD has been relatively weaker against currencies like the Euro or British Pound.
And there’s a big reason behind that and this is something that could soon carry connotations across several other markets.
On the below chart, we can see where USD/JPY and the DXY basket have diverged, illustrating how Yen-weakness has played a significant role in the US Dollar’s stall over the past seven months.
USD (via DXY) in Candles v/s USD/JPY in Blue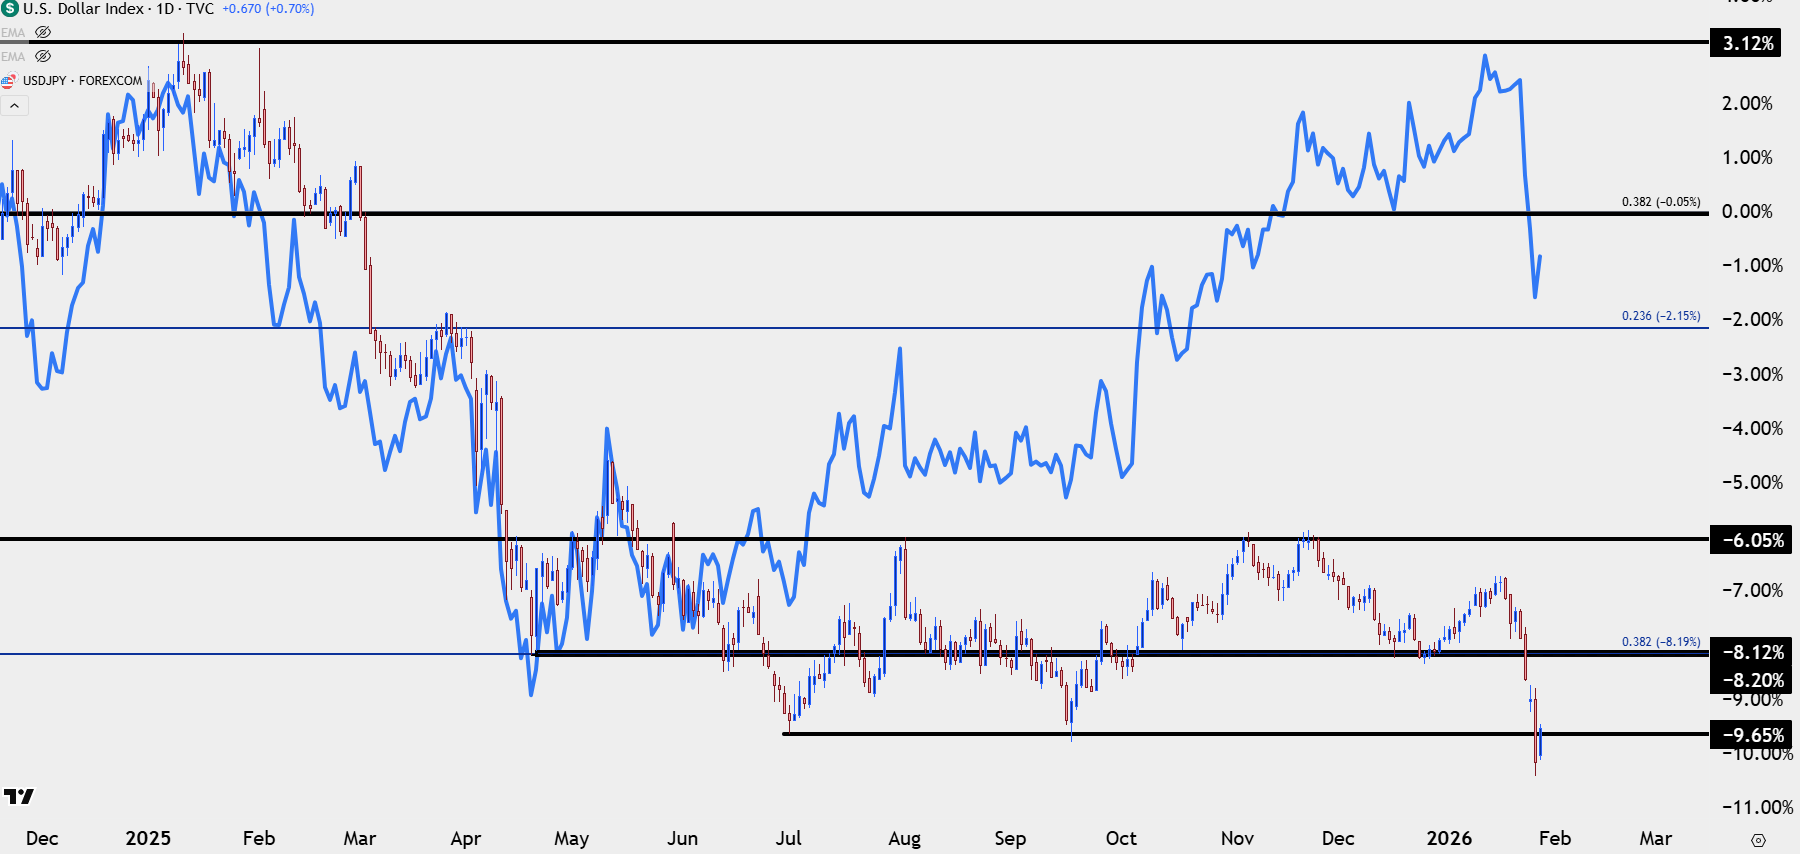
Chart prepared by James Stanley; data derived from Tradingview
The Path of Least Resistance
For spot FX traders rate divergence is pretty important as it can amount to a credit or debit to be accrued at the end of each trading day. So, if one is long a lower-yielding currency that can lead to an almost daily payment while being long the high-yielding currency can lead to a daily credit.
This is practically a built-in incentivization system to drive capital flows into higher rates, but there’s more to it than that, as these rate discrepancies can also lead to some significant business operations in the underlying economies.
In 2022, as the US was hiking rates aggressively to stem inflation, Japan was keeping rates pegged to the floor. The growing divergence in interest rates between the countries created the opportunity for a spread trade, where a hedge fund can go to Japanese banks, borrowing capital at low rates – and then taking that capital and investing it elsewhere.
The only problem with that arrangement is that the loans would be in Japanese Yen, and if the currency showed losses that could wipe out any benefit from the spread trade and perhaps even more. So – if embarking on such a setup it made sense to hedge that risk, and one way to do so would be to offset the JPY risk by selling it in the open market and, instead, buying a higher-yielding currency like the US Dollar.
This is what helped to create an almost 50% rally – in an un-levered currency pair – in about 21 months. The weakness in the Yen was so intense that worries began to build of the possible ramifications – that aggressive inflation could take over to the point where the BoJ would be forced to slam on the brakes with multiple rate hikes. And it was when USD/JPY crossed the 150 handle that the Ministry of Finance ordered them to intervene.
And then we saw positioning take over as the market then went in the other direction for the next few months.
The saga wasn’t over, however, as price found support in mid-January and at the time the fundamental divergence remained between the economies and the interest rate regimes, so bulls simply loaded back up and drove right up to the same high that had held the year before, of 151.95.
In November of 2023 we saw another episode of positioning taking over but this time, it was a mere 23.6% retracement as bulls took profits off the table ahead of year-end.
The year of 2024 saw buyers get right back on the bid and after a strong US CPI print in April, a breakout took over and USD/JPY made an almost direct run up to the next big figure of 160.00, and that’s where the current battle ground has been set.
USD/JPY Weekly Chart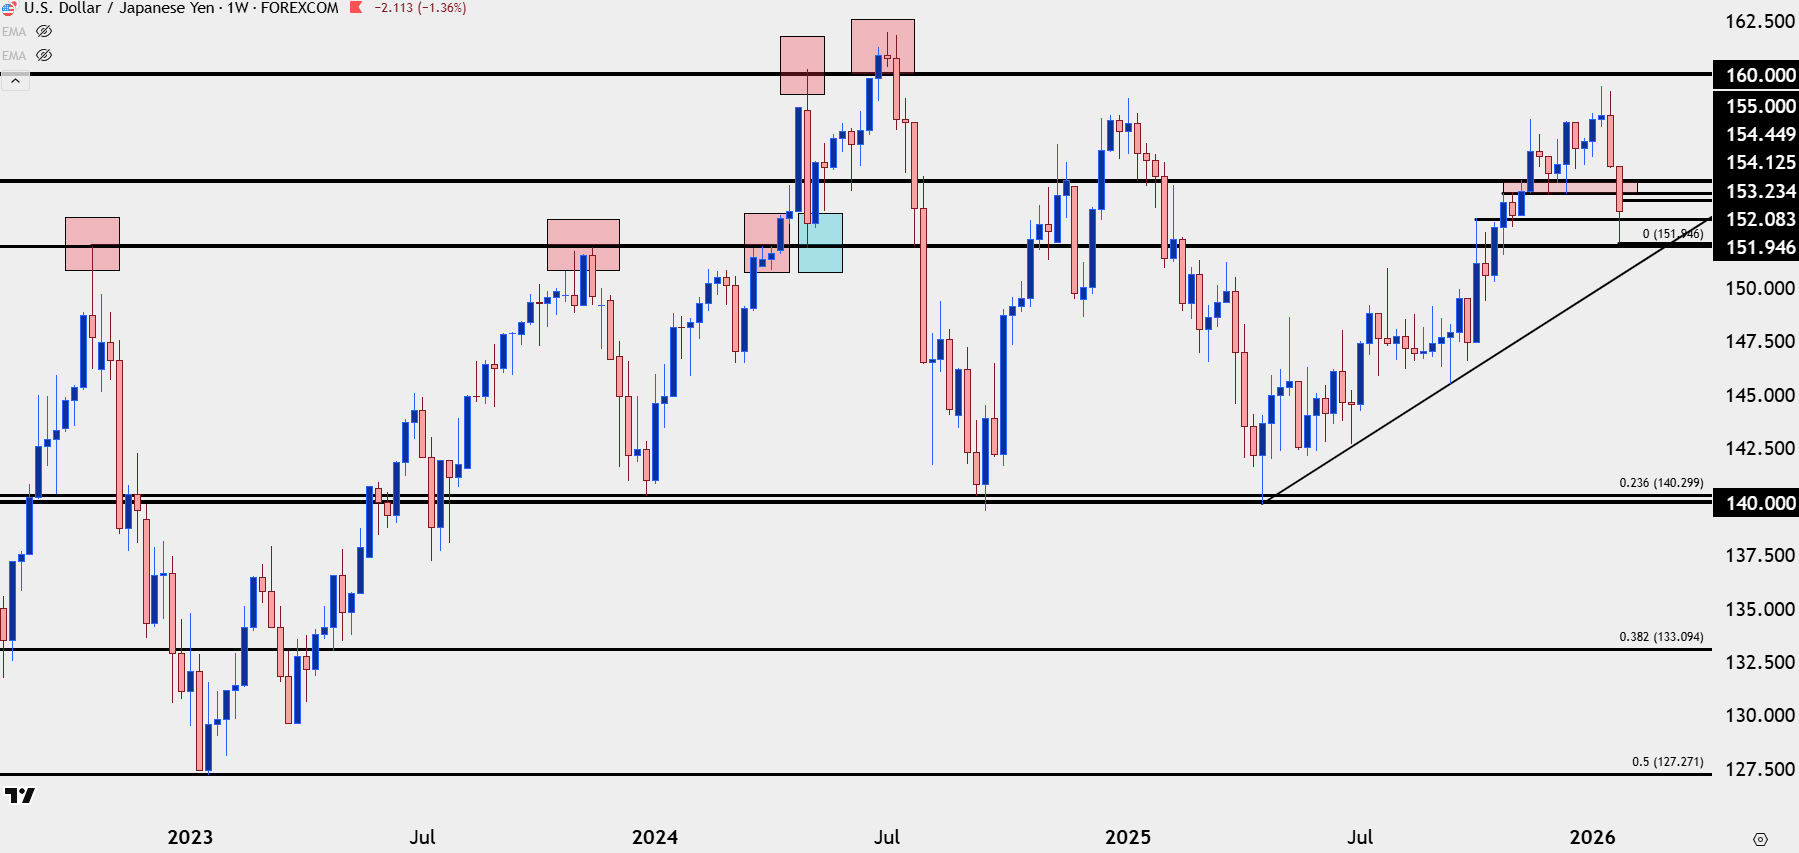
Chart prepared by James Stanley; data derived from Tradingview
USD/JPY 160.00
The BoJ’s initial intervention at 160.00 in 2024 failed, as buyers simply loaded up at 151.95, or prior resistance (the blue box, above) and ran it right back up to the next big figure.
In July of that year, something else happened and it was on the morning of a US CPI report. The Bank of Japan was coming into the morning ready to intervene and as US inflation printed below expectations, finally giving life to the idea that the Fed could soon cut rates, the bottom began to fall out.
Suddenly, those carry trades that had persistently held on even challenging the BoJ and the MoF with the break over the previously defended 150/151.95 level now had excuse to cut and run. And that’s precisely what they did as fears of not only continued intervention and defense of 160 took over, but it was punctuated with the possibility of narrowing rate differentials.
But what’s most interesting about that episode isn’t necessarily USD/JPY – it’s other markets, as the Nasdaq printed a bearish engulfing candlestick on that morning of July 11th as a major source of global leverage was suddenly under pressure. And as USD/JPY slalomed lower into the August 5th spike, so did US equities.
Because the funds and market participants that got loans in Japan for very low rates didn’t only invest in US debt, that capital spread. And with USD/JPY reversing aggressively there was little reason to hold those hedges and, in-turn, there was motivation to close some of the positions that were funded by that leverage.
This is the delicate balancing act that President Trump has ahead as a forceful move of USD/JPY could, potentially, create another carry unwind even that hits ‘handsomely priced’ US equities. At this point for USD/JPY, the line in the sand remains at 160.00 but the bigger question is one of positioning; as in, will hedges use bounces to take profits off the table for longer-term positions? Or will we see renewed strength as the rate divergence that remains in the pair still allows for that incentivization on the long side and disincentivization on the short side.
Notably, in these episodes previously, the trend-side run has been slower and steady while the countertrend moves have been violent episodes; or, put otherwise, ‘up the stairs, down the elevator,’ price action.
USD/JPY Weekly: Up the Stairs, Down the Elevator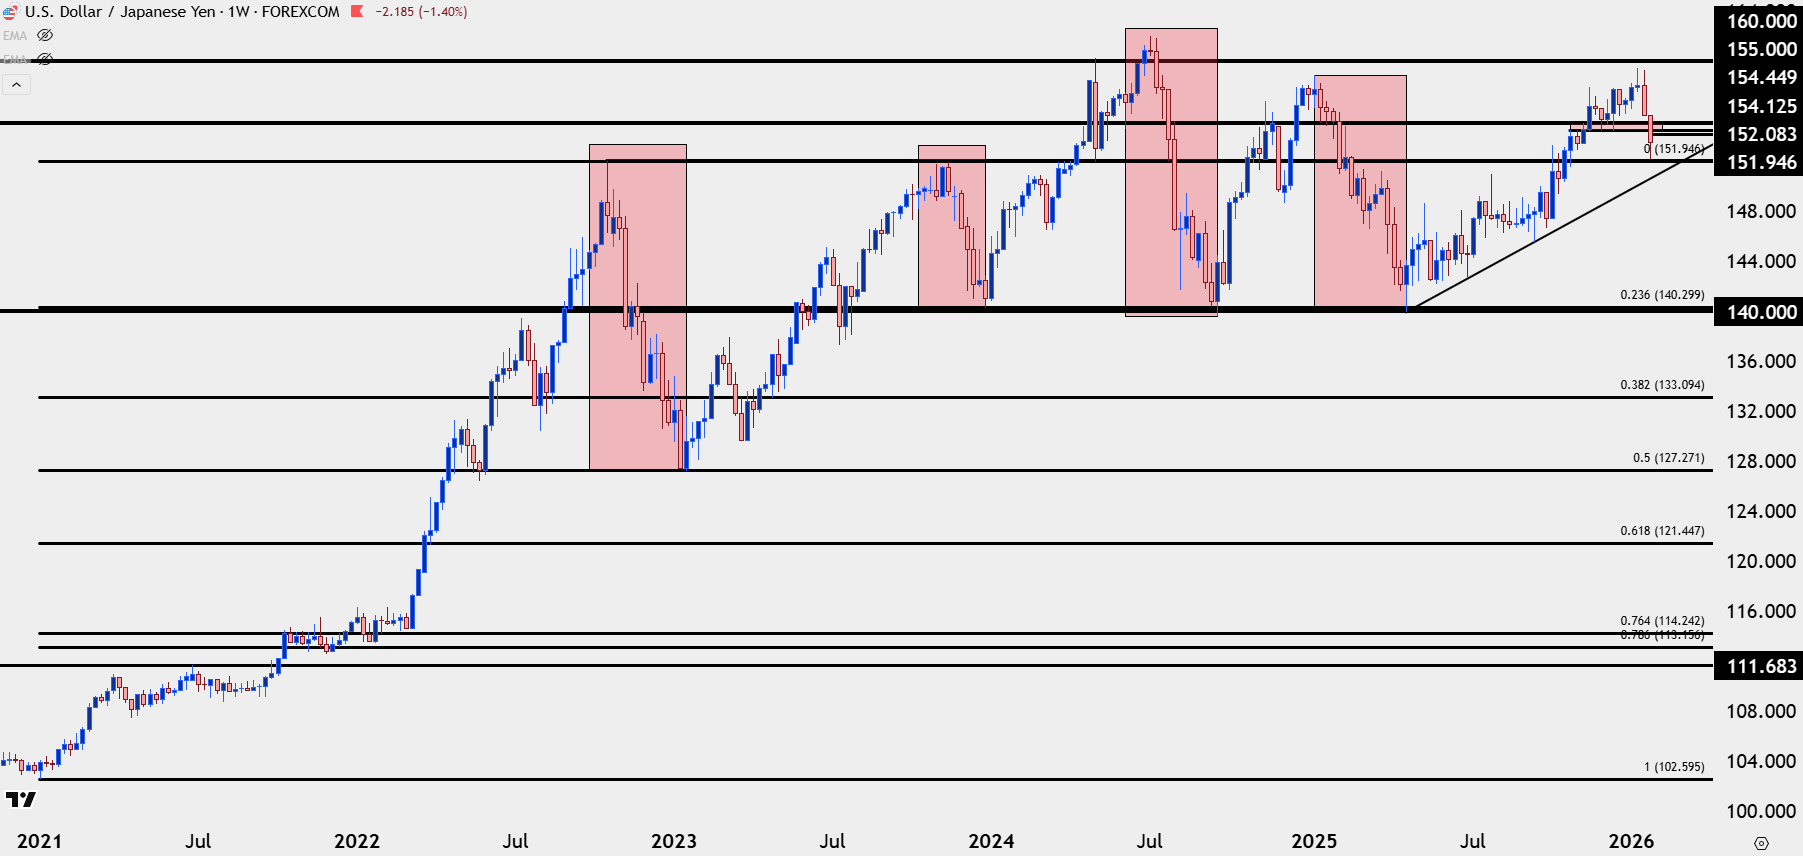
Chart prepared by James Stanley; data derived from Tradingview
--- written by James Stanley, Senior Market Analyst, Global Macro