
Intervention Threats and Profit Taking
At some point this year Japanese policy makers may be faced with the very unenviable position of having to either defend Japanese rates or the Japanese Yen. It certainly seems like doing both would be a challenge and with a weak Yen continuing to push the potential for higher levels of inflation, bond holders have been demanding higher yields to hold Japanese government debt. This likely stand-off has already produced a number of headlines and articles and theories as to why one or the other should begin to come down, but the reality is we’re breaking fresh ground here and there’s not a historical template that can be applied. And perhaps more importantly, this isn’t something where we can speculate on the end game as there’s several steps along the way.
But, like I talked about back in December before the BoJ hiked rates and USD/JPY extended its run, this is something that policymakers can take a creative approach towards addressing.
In Japanese yields, we can see 10 year JGB’s in a parabolic fashion ever since the election of Sanae Takaichi, rushing from around 1.6-1.7% up to the current level approaching 2.2%.
Japanese 10-Year Government Bond Yields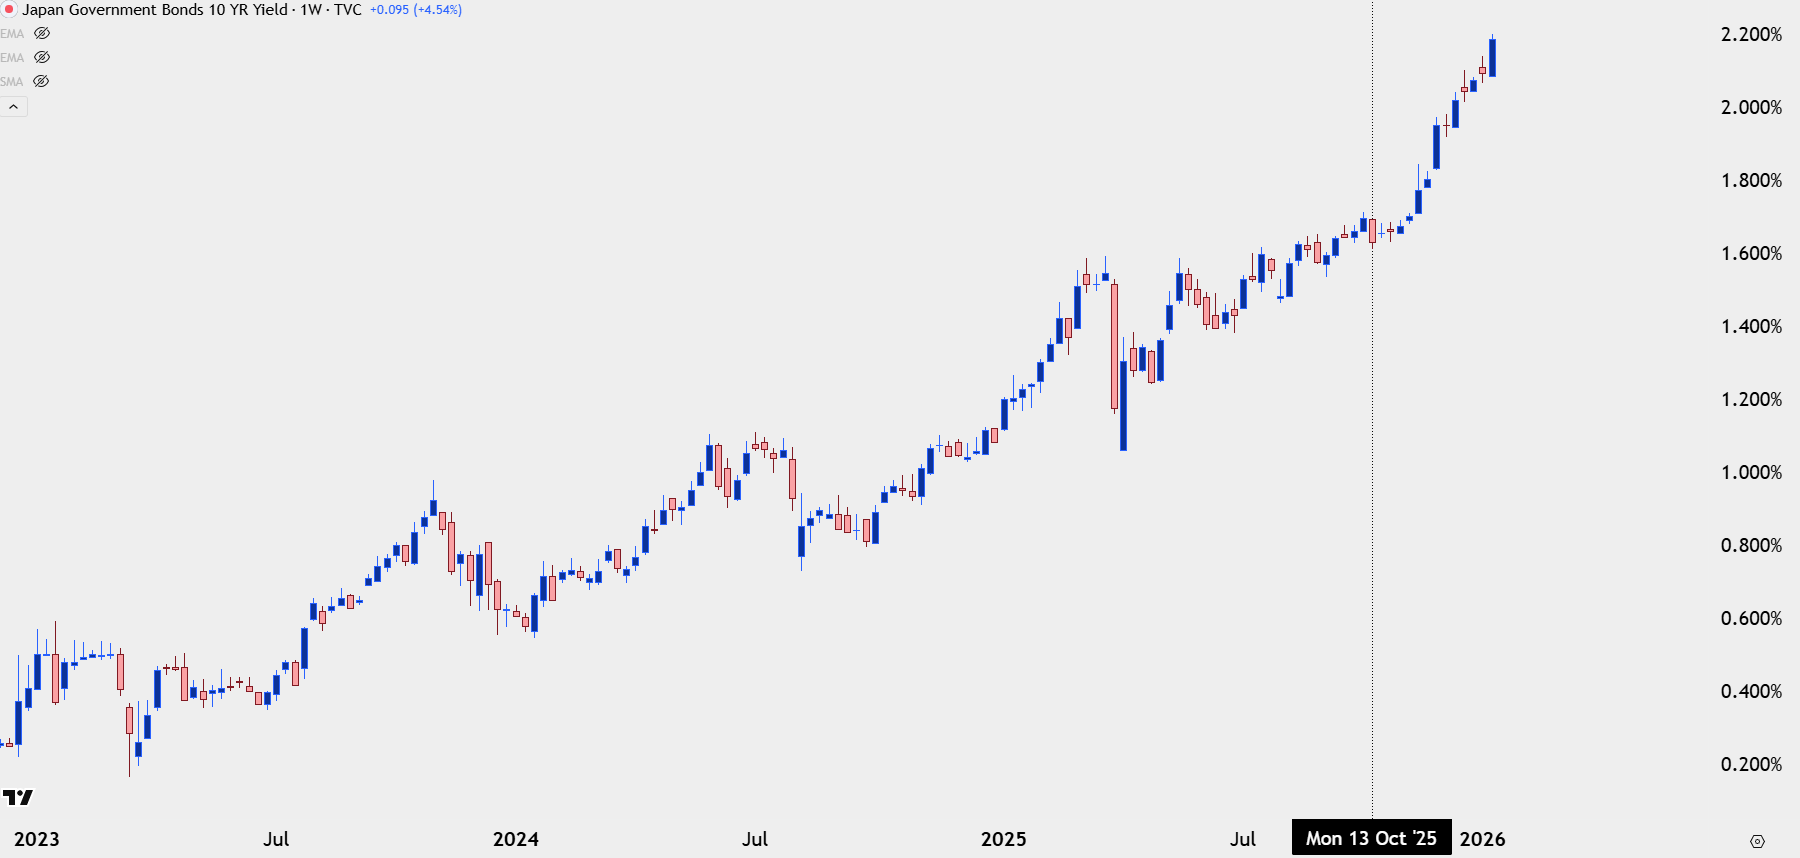
Chart prepared by James Stanley; data derived from Tradingview
A Rock and a Hard Place
Takaichi has previously called rate hikes out of the BoJ ‘stupid,’ and for an economy that’s worked through almost four decades of deflation and disinflation it’s a difficult argument to support, purposefully tightening policy in order to stem possible inflationary pressure. This is one reason that Yen-weakness themes have been so pronounced in the Abenomics run of 2012 and more recently in the 2021-2022 carry trade fueled USD/JPY rally from 102 up to the 160.00 handle.
But the Ministry of Finance is less concerned about the big picture growth concern and more concerned with Japanese Yen spot rates and the potential for runaway inflation should the currency continue falling in such an aggressive fashion. Over the past three-and-a-half years, those intervention efforts have produced a number of pullbacks, such as the initial defense of 150 back in 2022, or the 160 defense in 2024.

Notably, these intervention efforts are more like band aids, as the fundamental bias that built the trend in the first place remains in order; and the intervention simply drove a pullback that allowed bulls to get long at better prices. This is what explains the rally re-starting in January of 2023, or again around early-2024 until, eventually, bulls were able to break well-above 150 and run up to 160, at which point the MoF ordered another intervention but this time to defend 160. That brought about a week of weakness, with bulls simply loading up again on a re-test of the 151.95 level that had set the high in 2022 and 2023. It didn’t take long before buyers were up to another fresh high in July of 2024 and that’s when another major factor came to light.
USD/JPY Weekly Chart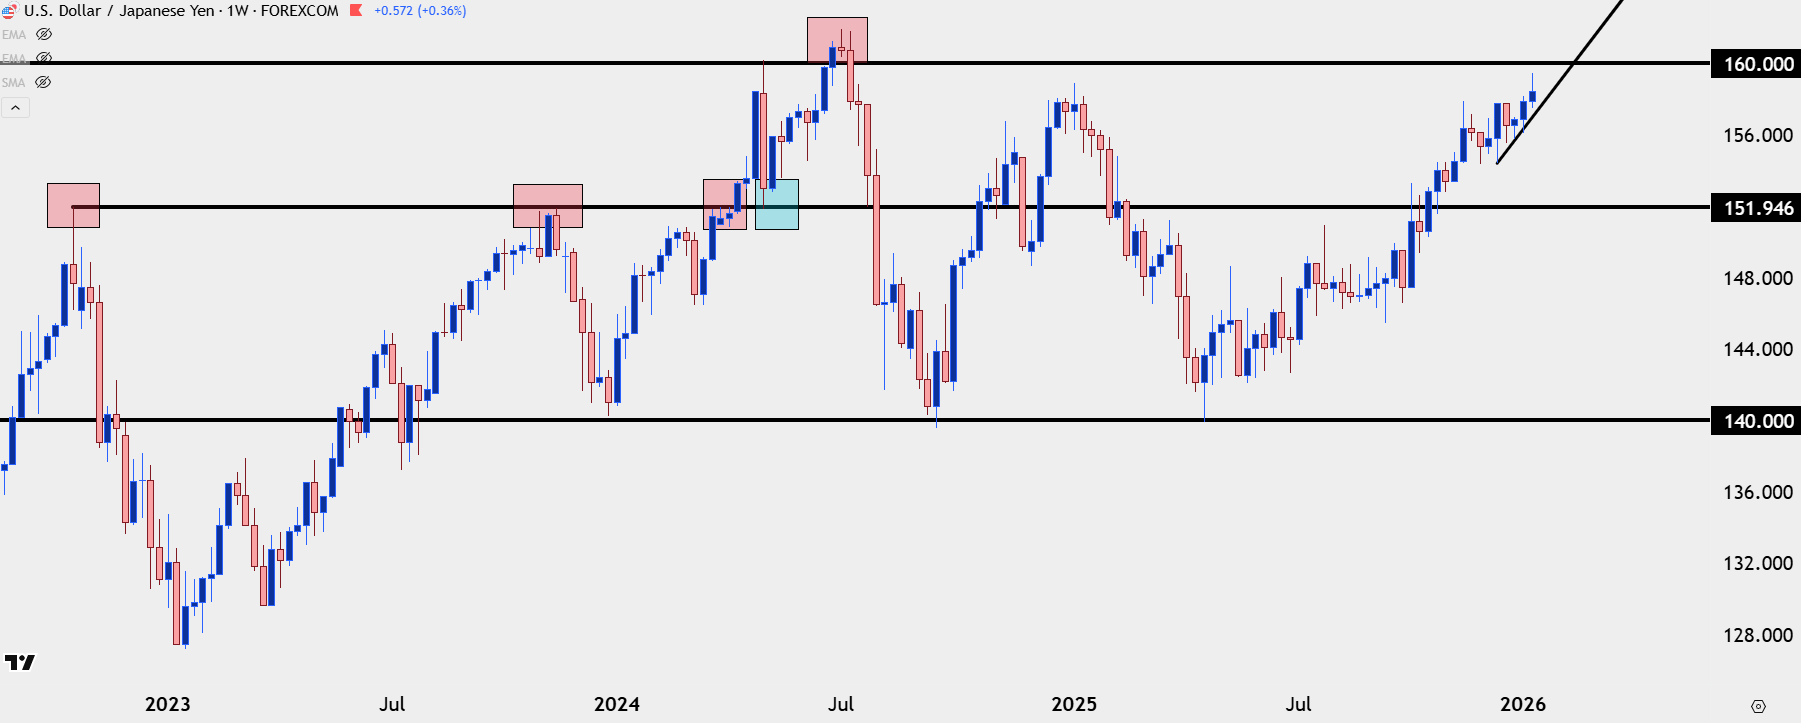
Chart prepared by James Stanley; data derived from Tradingview
The July 2024 Episode Produces a Cautionary Tale
It was after the failed intervention in early-2024 that the Ministry of Finance wanted to leave their mark. On the morning of July 11th that year, with a US CPI print set to be released, the Bank of Japan stood at the ready to once again intervene in markets by selling USD and buying JPY, essentially doing the exact opposite of what their very own monetary policy was encouraging at the time.
That CPI print came out below expectations and finally, it seemed as though there was an open door for the Fed to cut rates later in the year, and that combined with intervention efforts to pose a startling sell-off in the USD/JPY pair.
The problem is that it wasn’t only USD/JPY that was going down on the news, as US equities started to sell-off as well. It started with the high-flying AI trade and the Nasdaq index, but a week later, the S&P 500 topped and started to turn, as well. The carry trade was a source of global leverage and that leverage had seeped into US equity markets. And as the carry trade had started to unwind, helped by the initial stimuli of a BoJ fueled intervention and further driven by the prospect of lower rates in the US, that leverage began to come out of markets.
By early August of that year, the VIX index had spiked to its third-highest level ever, rivaling only the Financial Collapse and the Covid pandemic. Bank of Japan officials tried to calm tensions by highlighting no near-term plans to further hike rates, and that helped to slow the sell-off in the pair which eventually found support at the 140.00 handle a couple of days before the FOMC announced their rate cut in September of 2024.
That episode illustrated two important facts that remain relevant today: Given the rate disparity between the US and Japan, there’s likely still a considerable carry trade in the USD/JPY market, and if that comes off, the ramifications can be large. And the second point which is perhaps even more pertinent to USD/JPY price action, is the fact that to produce a tangible reversal in the pair, it’s going to require more than just intervention, there’s also going to need to be a legitimate prospect of rate compression between the two economies.
Lower US rates can do that, as can a significantly higher BoJ rate. The question then is whether either economy would want to deal with the fall out if those carry trades all start to come off with speed, such as we saw in the summer of 2024.
Delaying Doomerism
At this point that’s all just potential. And there’s also the possibility that something unknown or unexpected happens. Right now it seems that both the US and Japan wouldn’t mind seeing USD/JPY soften a bit, without the blowout of ramifications from an unwinding carry trade. So this brings on the possibility of some type of negotiation between US Treasury Secretary Scott Bessent and Finance Minister Satsuki Katayama. She had noted in comments overnight that there was agreement to the effect that both sides are cautions of one-sided moves in the USD/JPY spot rate.
For now, structure is still bullish in USD/JPY and to traders, I think that’s what matters most. But, as I’ve been saying for a while, bullish trends in GBP/JPY and EUR/JPY can be perhaps even more attractive, as that’s less of a pressure point for Japanese policymakers.
In USD/JPY, the setup looked at in yesterday’s webinar remains of interest, with support showing from prior resistance, which has so far been defended. That plots at 158.19, and just below that at 157.90 is another spot of prior resistance that hasn’t yet been tested for support.
There’s also a case for support at 156.67-157.17, and then what I’m considering as a decision point from 154.45-155.00.
USD/JPY Four-Hour Price Chart
Chart prepared by James Stanley; data derived from Tradingview
EUR/JPY
For two weeks EUR/JPY built an ideal backdrop for bullish continuation, with a bull flag forming into the New Year and that was punctuated with a shorter-term falling wedge inside of that formation, both of which led into a strong rally and a fresh ATH.
EUR/JPY has flown up to a fresh ATH while USD/JPY grinds just below that 160.00 level, and if we do see a bout of USD weakness, provided that it happens in a somewhat controlled manner, EUR/JPY strength can remain in favor. As of right now the pair is testing support around a spot of prior resistance, taken from 184.44, and there’s more reference for support a bit lower, around the 183.50 level.
EUR/JPY Four-Hour Price Chart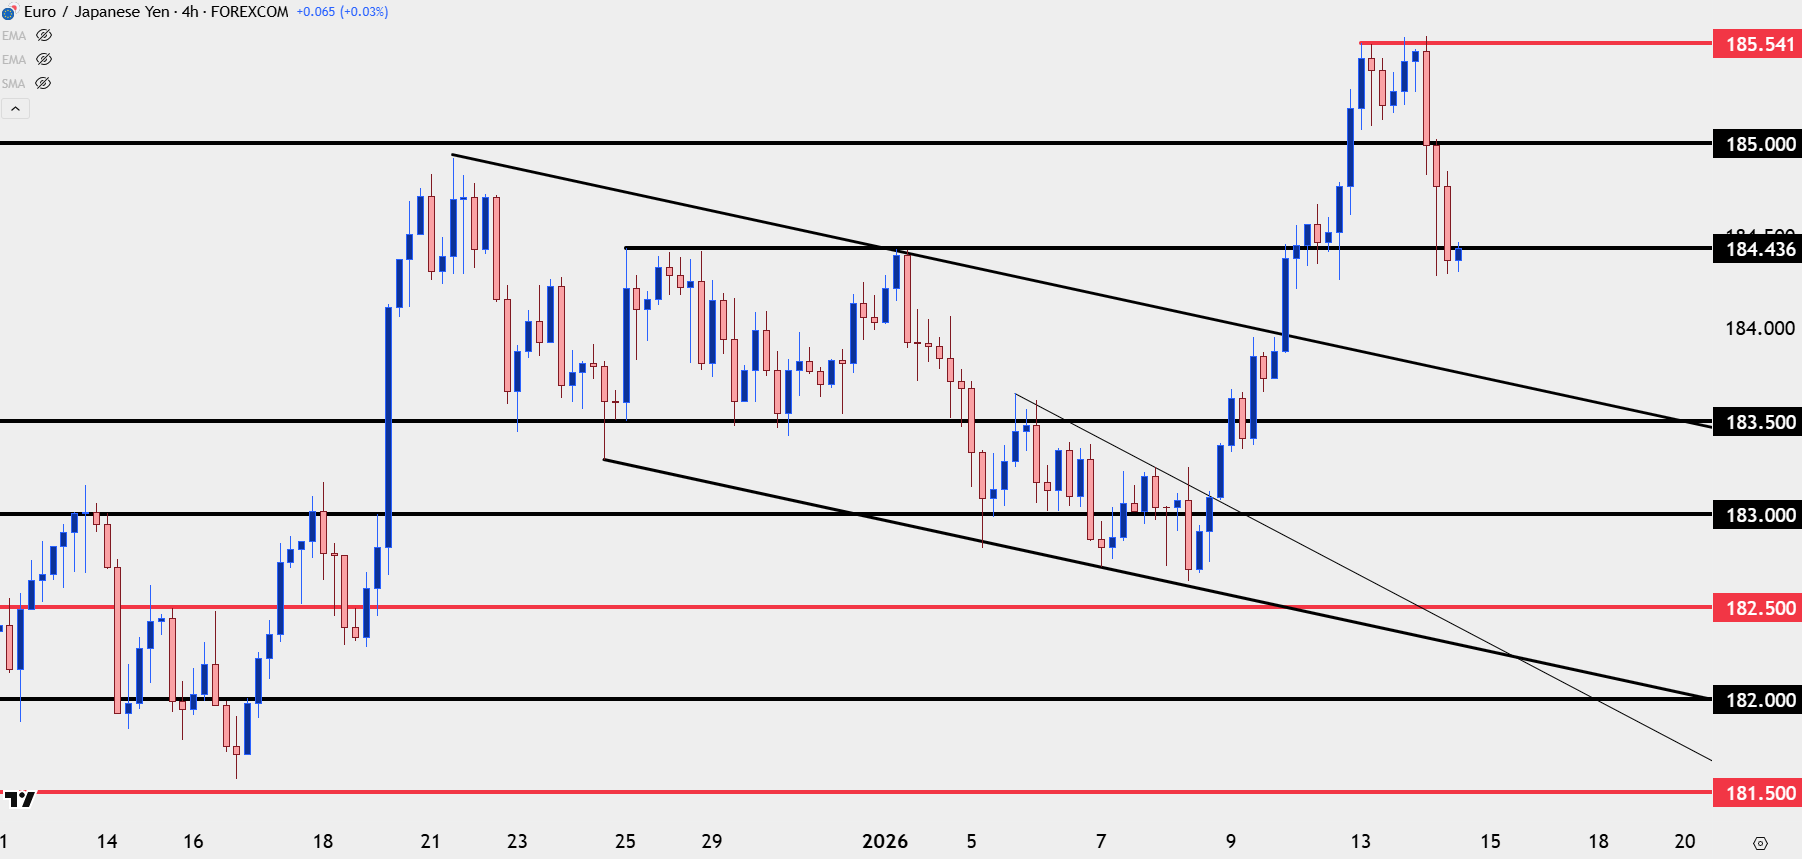
Chart prepared by James Stanley; data derived from Tradingview
GBP/JPY
As shown in yesterday’s webinar I’m still a bit more optimistic for GBP-strength versus Euro strength and that can play through against the Yen, as well.
While EUR/JPY was building the bearish channel to make up the bull flag, GBP/JPY held a flat range for more than a couple of weeks, with bulls making a statement move following a test of range support just about a week ago. That’s led to another strong rally in the pair and at this point, there’s a couple of spots for support as taken from prior resistance.
The previous swing high at 212.16 stands out, and below that, we have prior range resistance, which plots from around 211.42-211.49. And below that, we have prior range support, from 210-210.30.
If that third zone is taken out with a closed body break on the four-hour or daily, then something has shifted, as the below four-hour chart shows multiple tests and illustrations of respect at that zone.
GBP/JPY Four-Hour Price Chart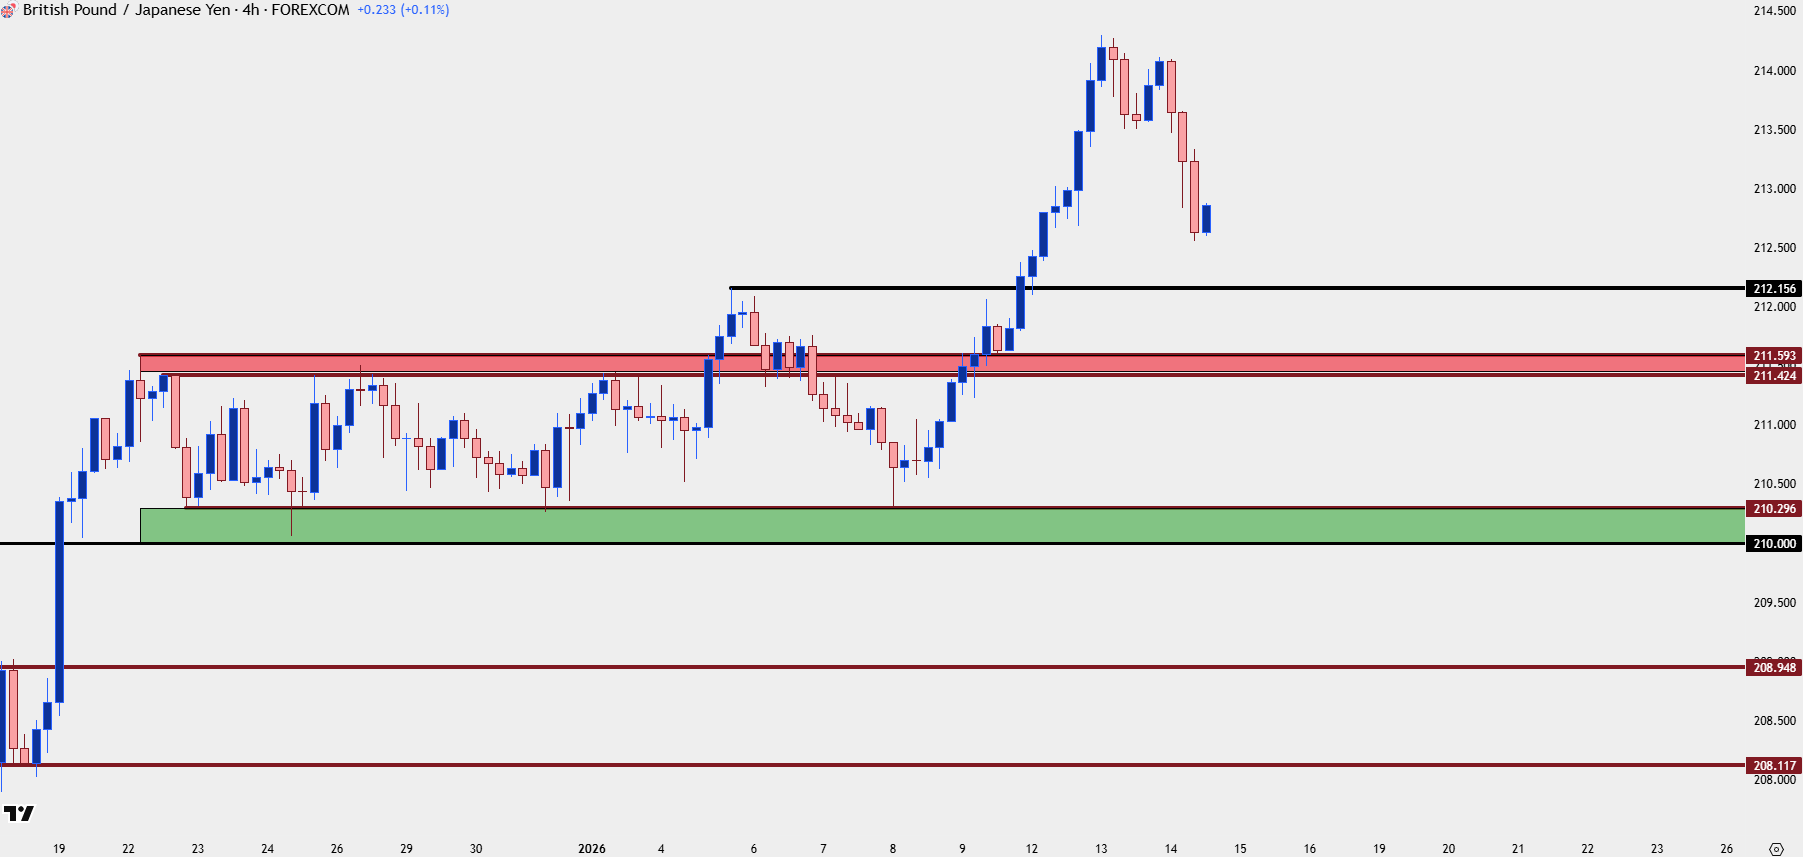
Chart prepared by James Stanley; data derived from Tradingview
--- written by James Stanley, Senior Market Analyst, Global Macro