Japanese Yen Talking Points:
- USD/JPY has built into a hard range over the past six weeks, with the last attempted breakout on the July FOMC and BoJ rate decision snapped back after the NFP report.
- EUR/JPY is nearing a major point of resistance while GBP/JPY is already testing a breakout above the 200.00 handle, both setups followed in these pieces and looked at in greater depth in the video below.
- I’ll be looking into all three markets in tomorrow’s webinar and you’re welcome to join. Click here to register.
USD/JPY remains in what’s become a very consistent range and that’s been the case since the first few days of August. Initially, USD/JPY broke out after the FOMC rate decision and that furthered on the BoJ rate decision in late-July. But the NFP report on the following Friday brought growth fears back around the US and USD/JPY was slammed back to support, which has held in the six weeks since.
Making matters there perhaps even more uninteresting is the fact that the range in USD/JPY has been just about 100 pips from recent support to resistance, which doesn’t allow for much intra-day volatility, either.
The fact that the USD has been weak in many other major markets highlights the fact that USD/JPY is essentially marrying together two very weak currencies. And that weakness could be more attractive elsewhere, with either USD or JPY paired up with a currency like the Euro or British Pound. I’ve been talking about this for some time now, including the late-July pullback. This is when EUR/JPY built support at the 170.00 handle, along with a higher-low, and GBP/JPY held support just four pips above the 195.00 level before bulls started to take-over again.
This week brings both the Fed and BoJ so there could be some motivation for trends, which I’ll look at below.
In the major pair of USD/JPY, if we do see a Fed go slightly less dovish than what markets are looking for, there could be motive for topside, similar to what showed in July when Powell sounded not ready to cut rates. That led to a sizable breakout in USD/JPY that continued through the BoJ meeting and given how heavily rate cut expectations have priced-in to the US, it doesn’t seem too low a bar for Powell to surprise to the upside.
That said, I think there’s still the very real question in that scenario as to whether USD/JPY would be the most optimal pair to work with that Yen-weakness.

USD/JPY Daily Price Chart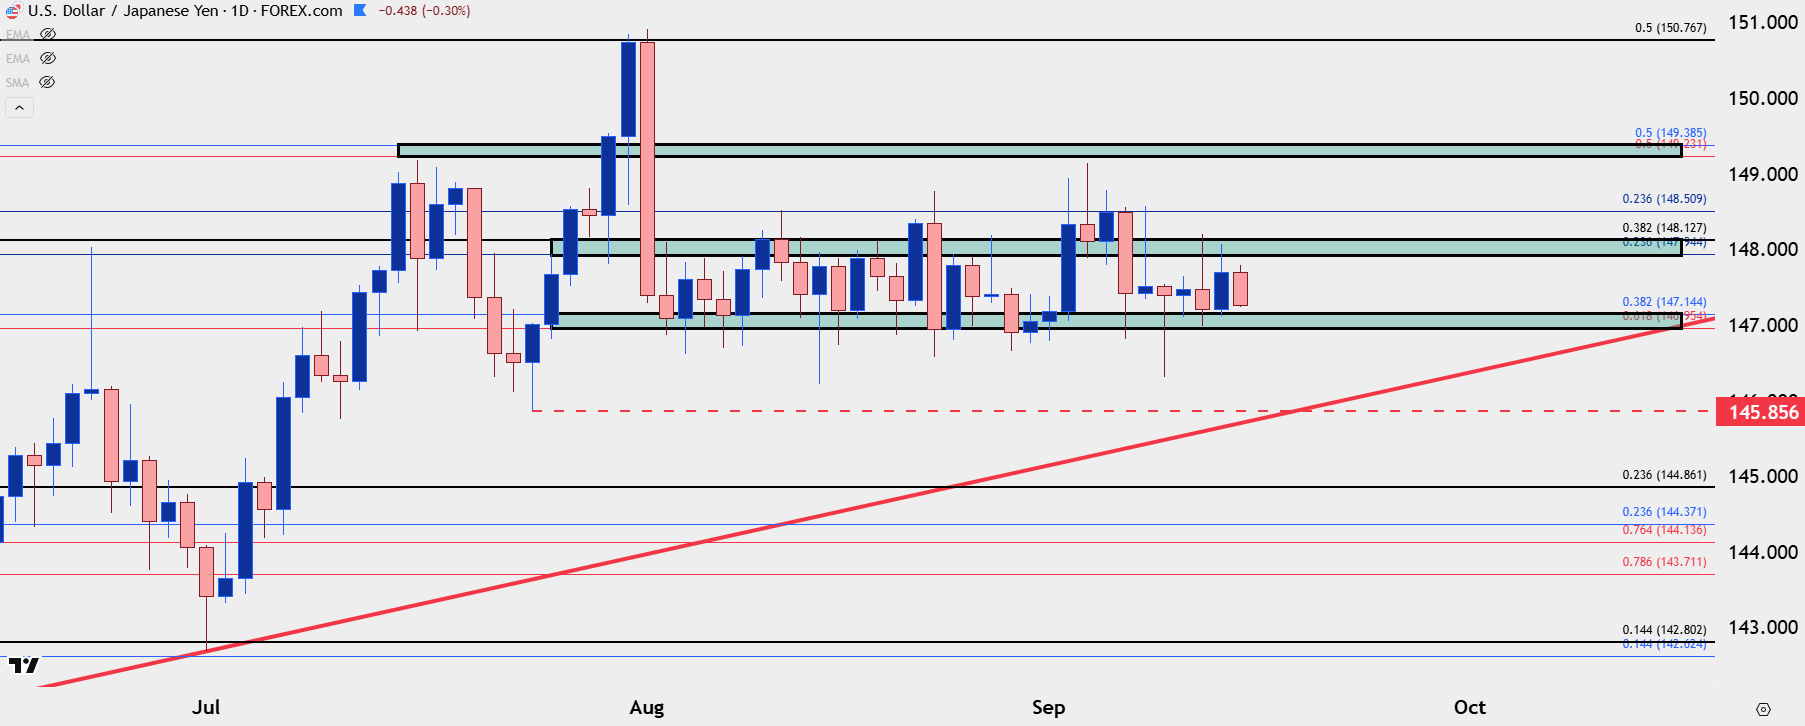
Chart prepared by James Stanley; data derived from Tradingview
EUR/JPY
Ahead of the Fed and BoJ rate decision in July, we saw some fast position squaring in EUR/JPY. The pair quickly snapped back for a test of the 170.00 handle, which caught a rally around the BoJ meeting as the bank didn’t sound ready to push more hawkish. But it’s from that major move that a Fibonacci retracement was born that continues to hold value today.
As looked at last week, higher-low support held around the 172.30 level, and now we have a shorter-term test of support at prior resistance, between the 76.4 and 78.6% retracements.
Taking a step back, there’s now an ascending triangle formation in-play on the pair and that’s a bullish breakout formation.
And on the fundamental front, Christine Lagarde sounded less dovish at the ECB meeting last week, saying that ‘the disinflationary process is over’ and that the Eurozone economy is in a ‘good place,’ so if we do see the Fed push into a more dovish posture, that sets up divergence amongst the Central Banks which could justify greater Euro strength. I covered this in the article over the weekend in reference to EUR/USD, but it can similarly be adapted to EUR/JPY, as well.
EUR/JPY Four-Hour Price Chart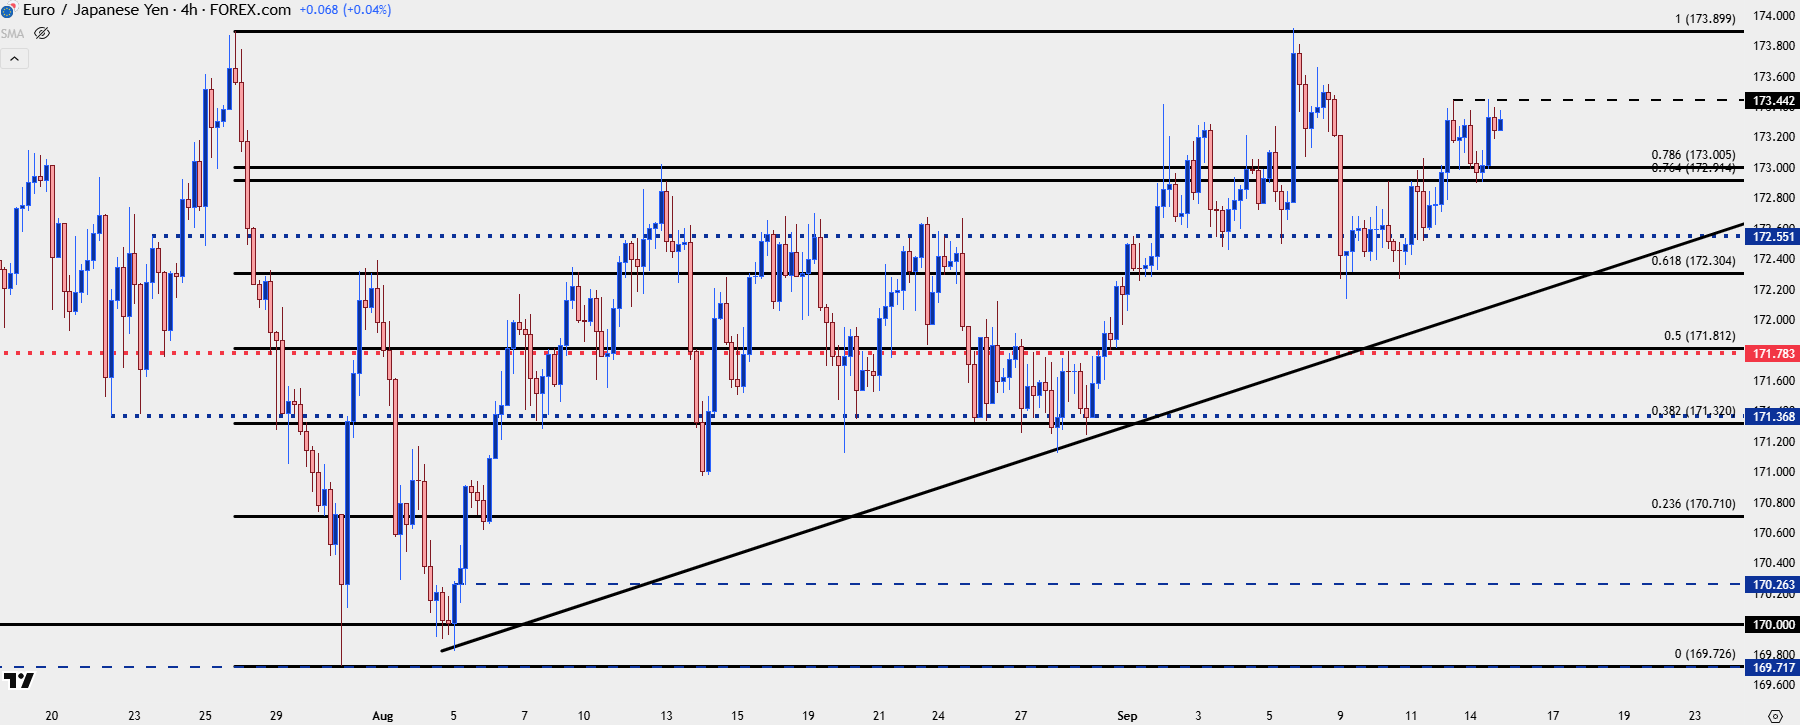
Chart prepared by James Stanley; data derived from Tradingview
GBP/JPY
I’ve favored GBP/JPY even over EUR/JPY, although that may shift this week after Lagarde’s comments at ECB on Thursday. But, from a price action perspective the British Pound continues to lead the way as this morning ushered in a fresh yearly high on the pair.
Perhaps more important, we’ve seen buyers showing up above the 200 level which is a major psychological level that has been resistance for almost two months now. That level helped to produce an ascending triangle into the breakout that started late last week, and the price at 200 is now support potential after bulls showed up to defend the level after the weekly open. In the video, I highlighted how a higher-low could be looked for in a subsequent pullback scenario.
GBP/JPY Four-Hour Price Chart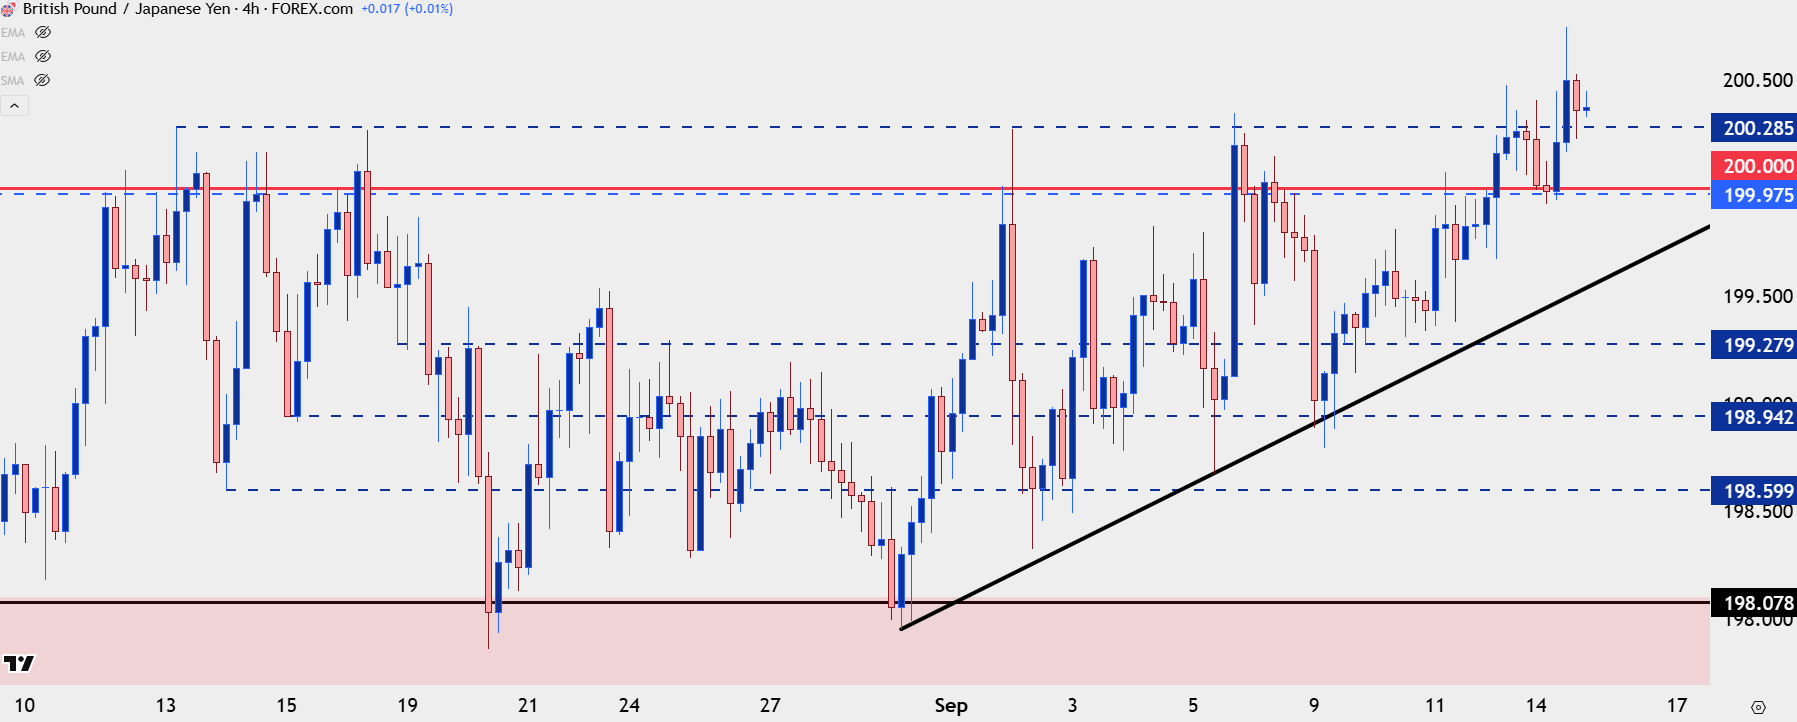
Chart prepared by James Stanley; data derived from Tradingview
--- written by James Stanley, Senior Strategist