
It has been a mixed session so far this Thursday, with US index futures climbing and the UK’s FTSE breaking out on the back of the oil rally, but top shares indices in Germany and France struggling. With gold and silver rallying and cryptocurrencies remaining under pressure, it was once again safe havens doing much of the heavy lifting. The mixed signals and the lack of any meaningful new catalysts suggest markets may not be ready to lift off to stage the seasonal end-of year rally. The S&P 500 forecast is delicately balanced. The index has been stuck inside a tight consolidation range since the last week of November, unable to break out decisively. Yet, the downside has equally been limited, pointing to range-bound market awaiting direction. Where will that catalyst come, and will it be bearish or bullish?
What’s moving markets today?
The big news is the oil-price rally after Oresident Donald Trump announced an oil blockade on Venezuela. The news lifted shares in energy stocks in Europe – the likes of BP and Shell helping the UK’s FTSE 100 to outperform. Brent oil rallied more than 2%, albeit this comes a day after prices reached their lowest levels since 2021. At the same time, the US is reportedly preparing another round of sanctions on Russia’s energy sector should Putin reject a Ukraine peace deal. Unsurprisingly, that cocktail of supply risk and geopolitical tension pushed gold near its October’s record high, and silver broke to fresh record highs above $66, even though the US dollar found renewed support across the board, and yields climbed higher.
What now after the mixed jobs report?
The initial dollar weakness in reaction to yesterday’s mixed jobs report didn’t last long, as the majors came off their best levels and have since weakened to trade lower than they were prior to the release of the data. Treasurys sold off modestly and this helped to underpin yields, with traders holding back from pricing in earlier or more aggressive rate cuts. November’s jobs numbers feel more like confirmation of the existing rate path rather than a fresh catalyst, which means the Fed will be in no rush to cut – particular if inflation remains sticky. Speaking of inflation, the focus will turn to the CPI release due for release tomorrow, with the headline CPI seen rising to 3.1% from 3.0% previously.

Watch for any further signs of tech leadership rotation
As the year draws to a close, a clearer narrative has emerged in recent weeks: the mega-cap technology stocks that have powered this bull run may be losing their ability to carry the market on their own. Confidence in the sector is being challenged, particularly over whether stretched valuations and heavy spending on artificial intelligence can still be justified. Those doubts grew following disappointing earnings from Oracle and Broadcom last week, widely viewed as bellwethers for AI-driven demand. Their results fell short of lofty expectations, adding to concerns that optimism around the theme may have moved ahead of fundamentals.
If we see renewed strength in tech names, then this could be the catalyst to drive markets to new highs. You want sectors that have been leading all year to at least hold up while other sectors play catch up. Energy names will be in demand today if oil prices remain supported.
Bond yields remain the dominant risk factor
The near-term direction for equities will also depend on developments in the bond market. Rising Treasury yields tend to put the most pressure on high-growth technology shares, and last week offered a clear reminder of that relationship.
Yields initially fell last week, after the Federal Reserve signalled openness to further easing and announced additional bill purchases to replenish bank reserves. However, that support quickly faded as yields moved higher again, pulling equities lower in tandem.
With yields remaining supported, this hardly aligns with a market fully convinced the Fed is shifting decisively towards a more dovish stance. Instead, it reinforces the view that interest rates may remain elevated for longer, a potentially negative backdrop for tech-heavy indices. Yields will need to move lower, else it could trigger renewed volatility in risk assets as the year end approaches.
S&P 500 forecast: Technical analysis
The S&P 500 forecast remains technically bullish, but the price action over the past few sessions does raise the question of whether the rally is beginning to lose momentum as the holiday period approaches.
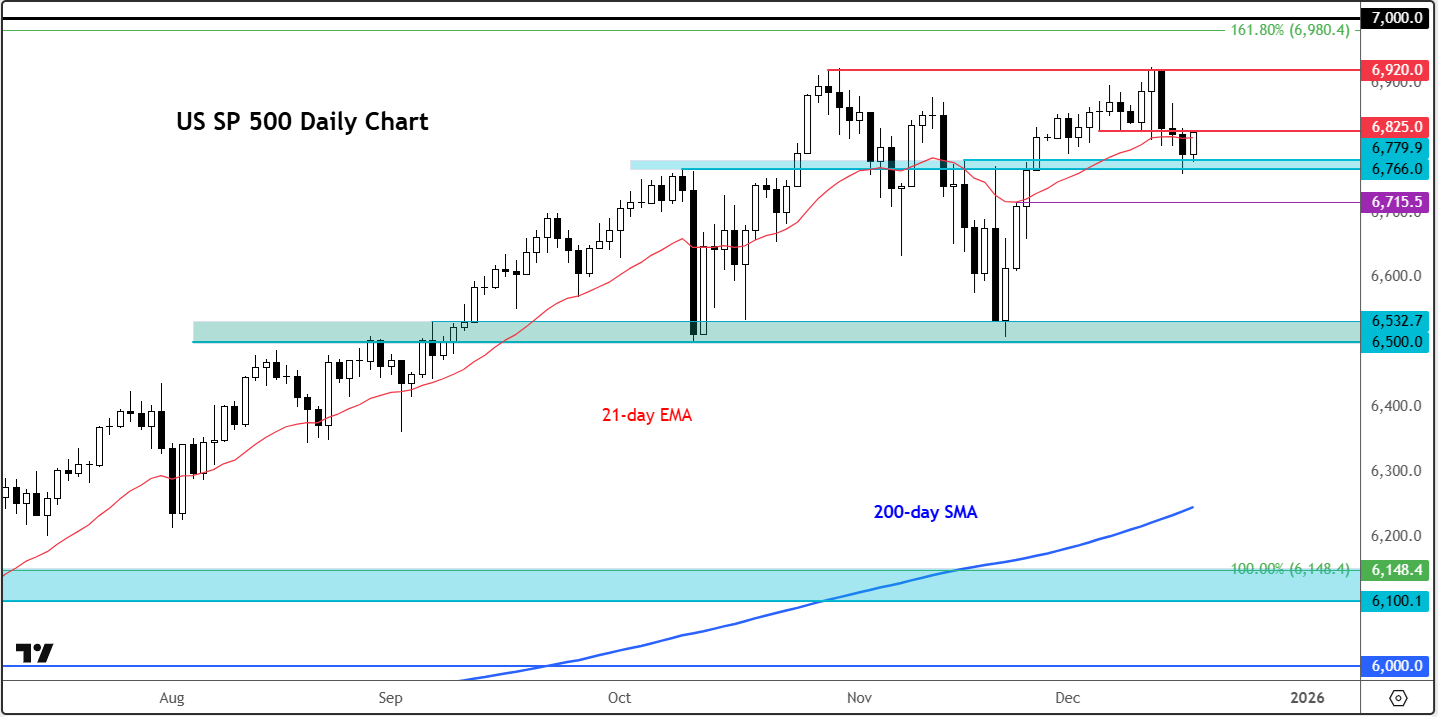
On the US SP 500 chart, based on S&P 500 futures, a key support zone is defined between 6765ish and 6778. This area previously acted as resistance, and as long as the index remains above this range, the broader bullish bias remains valid.
A decisive break below this support, however, would likely encourage sellers, initially exposing 6715, followed by the 6700 level. If downside momentum accelerates, a deeper pullback towards 6600 cannot be ruled out.
On the topside, initial resistance is seen around 6825, above which you have 6875/77 which had repeatedly capped upside attempts until last week’s short-lived breakout to a new high. So, a clear daily close above it would signal an end to the recent consolidation phase. In that case, the odds of a move beyond the October high at 6922 increases, with a push towards the 7,000 level becoming a realistic next target.
-- Written by Fawad Razaqzada, Market Analyst
Follow Fawad on Twitter @Trader_F_R