Stocks set fresh all-time-highs on Friday with both SPX and NDX gapping at the open and refusing to fill that in, helped along by the Friday CPI report. Next week brings some massive drivers with the Fed and Core PCE report set for release on Friday.

The tariff scare of two weeks ago is now firmly in the rear view as stocks were able to overtake prior highs this week, helped along by a strong opening gap on Friday following the CPI report. With the US government remaining shut down and the Fed highly expected to cut rates next week, there seems to be few reasons for investors to consider anything other than the rally that’s remained in place for much of the time since the April pullback.
Interestingly, however, it’s Powell’s performance at next week’s rate meeting which could potentially present some counter-trend motive. At the rate cut announcement in September, stocks initially pulled back on the announcement. There was a gap-higher the next morning and that gap came in as support a week later; but at Powell’s presser in July investors were starting to second guess rate cuts and that led to a large sell-off a day later, and that even lasted into the end of the week following the release of Non-farm Payrolls, when USD rallies were quickly extinguished in most major pairs.
I bring this up because chasing at this point, particularly after the unfilled gap on Friday fueled by that CPI release, is incredibly difficult from a strategy perspective. This isn’t necessarily something that’s attractive to fade because bulls have just continued to push, but it can highlight the value of patience and trying to pick an opportunistic mechanism for trend continuation.
From the daily chart of SPX there’s now a rising wedge that’s built and these are often approached with aim of bearish reversal. I would want to first see a breach of the 6700 handle before I would entertain short-term bearish stances, but even then, I think I’d prefer to bias this as bullish and wait for support to come into play at a level like 6550.
For shorter-term support, it’s the Friday gap that begins at 6738 and runs up to 6772 that remains of interest.
S&P 500 Daily Chart
Chart prepared by James Stanley; data derived from Tradingview
Nasdaq 100
The Nasdaq 100 similarly gapped-up on Friday and set a fresh all-time-high but the difference is that ahead of the move, there was a horizontal level of resistance that had held around 25,180. That, combined with the higher-lows, made for an ascending triangle and those are often approached with aim of bullish breakout, which is precisely what hit on Friday morning after the CPI report was priced-in.
That level also presents an attractive area to look for support to play. It’s a clear and obvious level so if it doesn’t hold, the concern is for a greater retracement or pullback scenario as likely something in the fundamental backdrop has shifted. And if that’s happening, patience on the pullback would likely be a warranted way forward, looking for something similar to what I had talked about in the Q4 forecast for equity indices.
Nasdaq 100 Daily Chart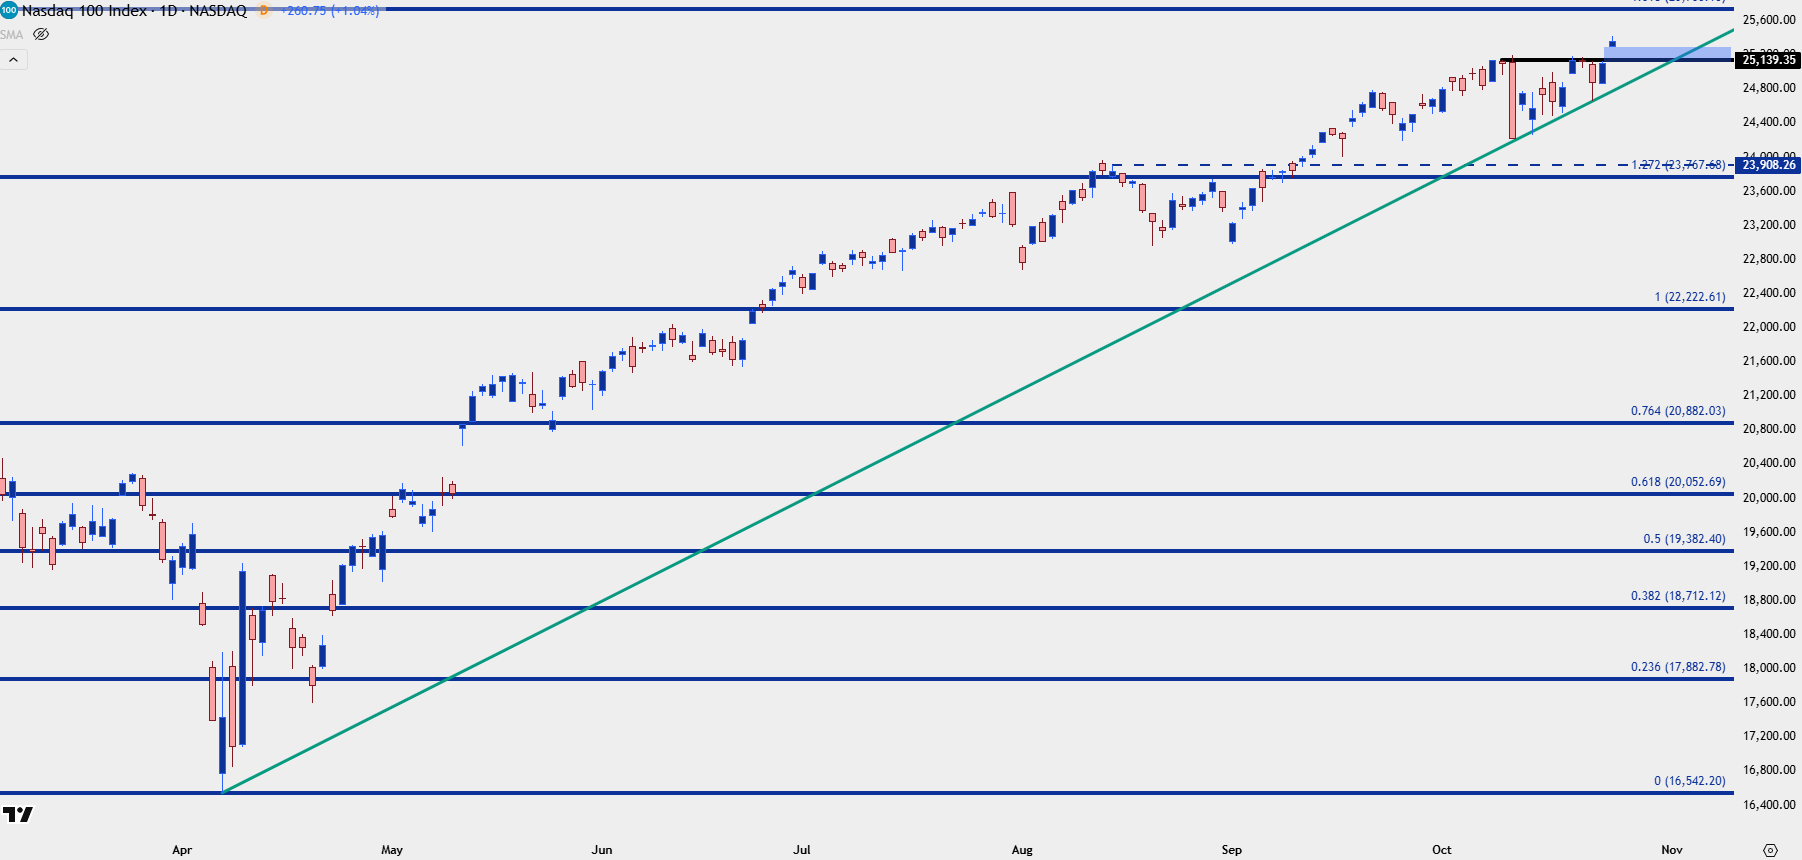
Chart prepared by James Stanley; data derived from Tradingview
--- written by James Stanley, Senior Strategist