Stocks Talking Points:
- The S&P 500 showed a max drawdown of more than 21% to the Q2 lows but that was followed by a massive rally to fresh all-time highs.
- The Nasdaq showed an even nastier sell-off but support played in the ‘s3’ zone from the Q2 forecast, followed by a 36% rally and fresh ATHs into the Q2 close.
- I remain bullish on equities but like I had looked at in the 2025 forecast, patience is important as chasing whilst at fresh all-time highs can be a perilous endeavor.

As we came into Q2, a semblance of change had shown in U.S. equities. Stocks were looking at their first quarterly loss in two years, since the FOMC had to keep markets in check with possible rate hikes to stem inflation, but this time, the driver was opaquer in nature as fear of tariffs had led to profit taking in many risk-on trades.
I retained a somewhat bullish outlook, if not a bit cautious, for the very same reason that I have been bullish on equities for the past few years, and that’s the vested interest that most parties seem to have for equities to continue their ascension. I documented this in-depth in the 2025 yearly forecast for equities and as I said then, despite some possible signs of bubbles in AI names, there was little reason for policymakers to move away from the support that’s become commonplace in the post-GFC era.
Last year was pretty clear, even with inflation showing well above the Fed’s target via most data points, the Fed pushed through rate cuts anyways. And not just a little nudge lower, it was 100 bps of softening in the final three-and-a-half months of 2024 trade, which is closer to a reset in rates, historically speaking. That softening also led to a rise in inflation, one that the bank needed to take into account in the first-half of the year. They didn’t say that clearly, however, as they instead pointed the finger at the inflationary potential of tariffs which remains a debatable topic. While many economists seem to agree that tariffs can cause supply chain disruptions which can cause higher prices from an unsettling in the supply-demand equilibrium, the fact of the matter is that there’s dearth of data around such effects; so this is widespread speculation and projection on behalf of the FOMC.
Paradoxically, the bank also forecasts that tariffs could hinder growth, which would, in essence, depress demand; so, I remain of the mind that the alteration to prices on the basis of tariff potential remains more of a question mark than a surefire sign of rising inflation. But, perhaps more important than my own personal theories on the matter is what the market is suggesting and in equities, it was Trump’s softening on tariffs in Q2 that allowed for one of the most epic rallies in equities that the world has ever seen.
This causes me to reiterate my stance, where the long side of equities remains attractive, but only after pullbacks and some evidence of support. Chasing can lead to undesirable outcomes and for the individual trader, the equation must be weighed as to whether their fear of missing out is more important than 10 or 20% drawdowns, such as we saw in the Q2 open. And there is the potential that prices do continue to fall, particularly if we see Trump remain hardline on tariffs and the Fed remain avoidant of dovish policy, which is another reason why chasing stocks at highs can feel like a perilous endeavor at this point.
With SPX trading at another fresh all-time-high as of this writing, there’s quite a bit of nearby support context, including the 6k psychological level which still hasn’t shown a convincing case of acceptance. Below that, a wider zone appears that was resistance-turned-support in late-Q1 and in the middle of Q2, and that runs from a prior gap of 5770-5864. If bulls fail to hold that on pullbacks, we may be in for a deeper retracement, which I’ll examine from a longer-term chart below.
S&P 500 Daily Price Chart
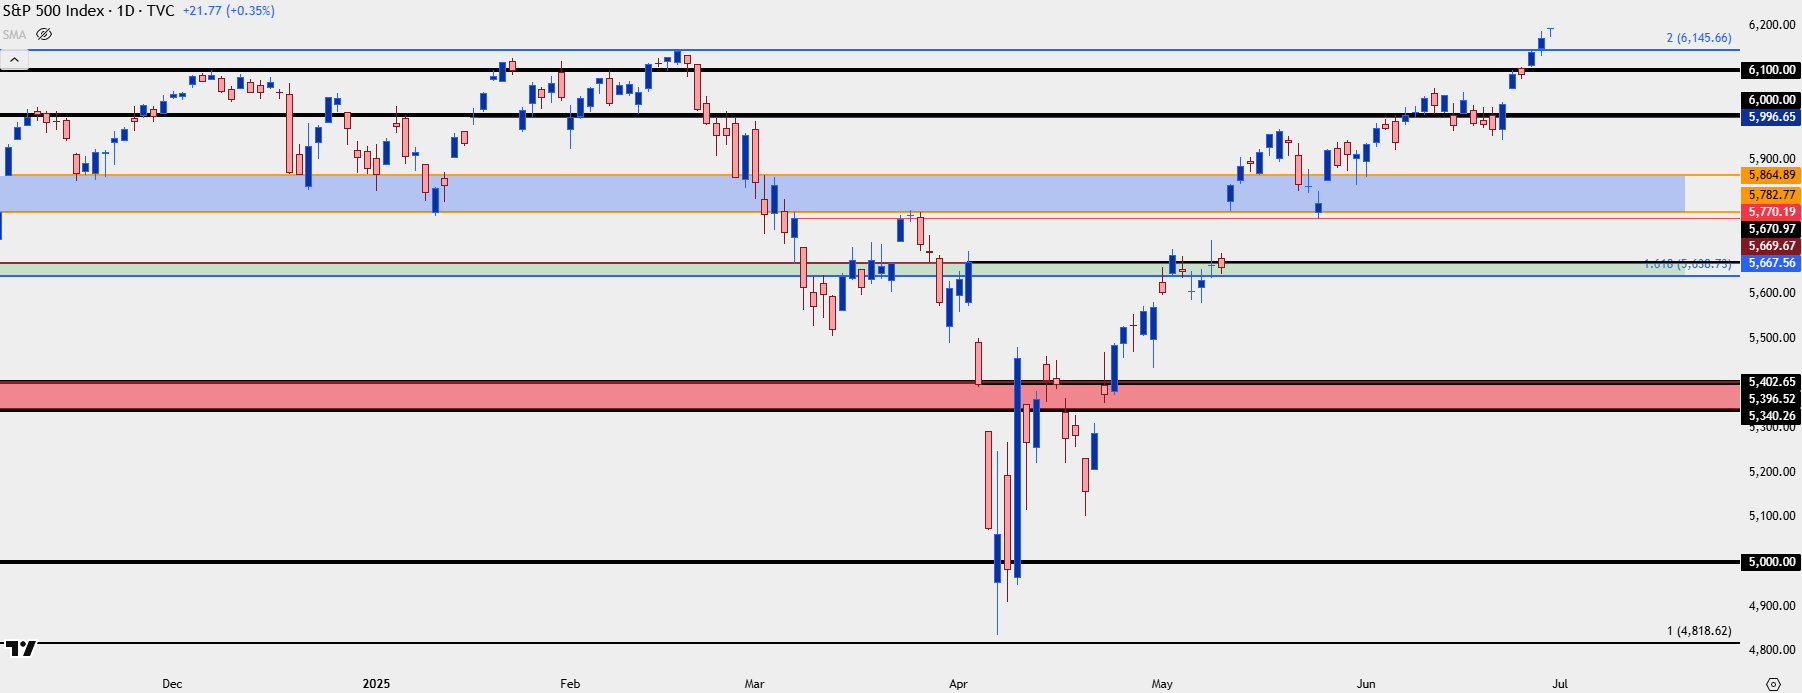
Chart prepared by James Stanley; data derived from Tradingview
Below the above support zone is another gap that’s quite visible from the weekly chart. That gap runs down to a key Fibonacci level of 5638.73, which is the 161.8% extension of the 2022 sell-off. If we see bulls fail to hold support above the zone mentioned above, that becomes a key decision point. It could still be tracked for bullish continuation but buyers should be on guard of a resistance hit after a corresponding bounce, because that would set the table for shorter-term lower-lows and lower-highs and failure to hold above 5770 would signal possible change ahead.
A bounce from 5638.73 with a show of lower-high resistance in the 5770-5864 zone opens the door for a deeper pullback, which would then highlight support levels in the 5527-5572 zone, after which a familiar area would come back into the equation at 5340-5402.
After that, the 5k level would be back in the picture and similar to what we saw in Q2, that becomes a major point of contention for bigger picture looks in the index. There was a bit of penetration below that price last quarter but it was brief, as we saw an oversold reading on weekly RSI for only the second time in the past 15 years.
S&P 500 Weekly Price Chart
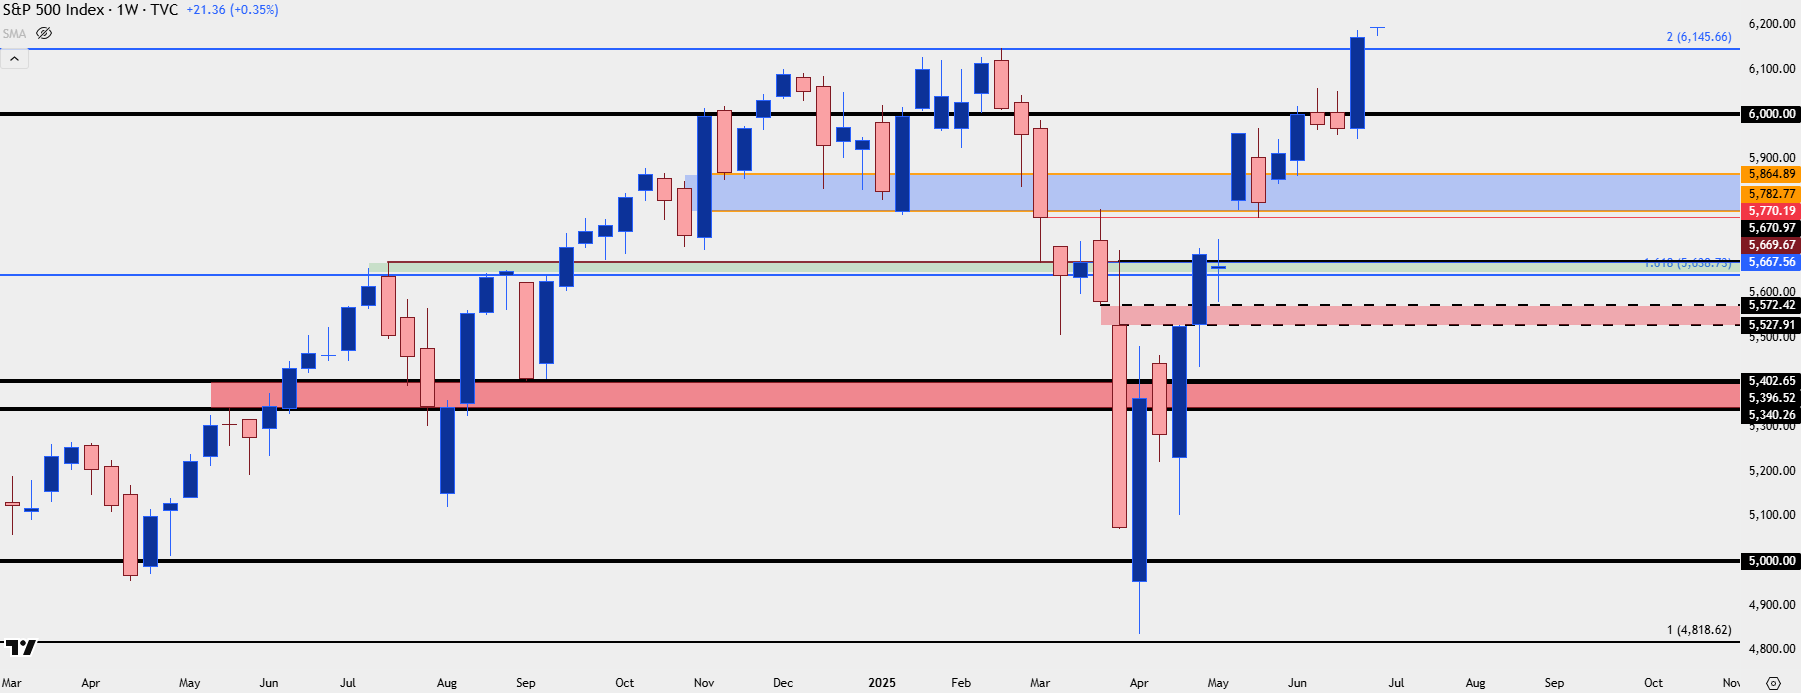
Chart prepared by James Stanley; data derived from Tradingview
Nasdaq 100
The tech-heavy index had a similar spill to start Q2 followed by an even stronger bounce from the lows. The third zone of support in last quarter’s forecast is what caught the lows in early-April, plotted from 16,764 up to 16,969. That led to a bounce of more than 36% which, like the S&P 500 above, is a difficult move to chase higher.
Below is the same chart from the Q1 forecast with no alteration.
Nasdaq 100 Daily Price Chart
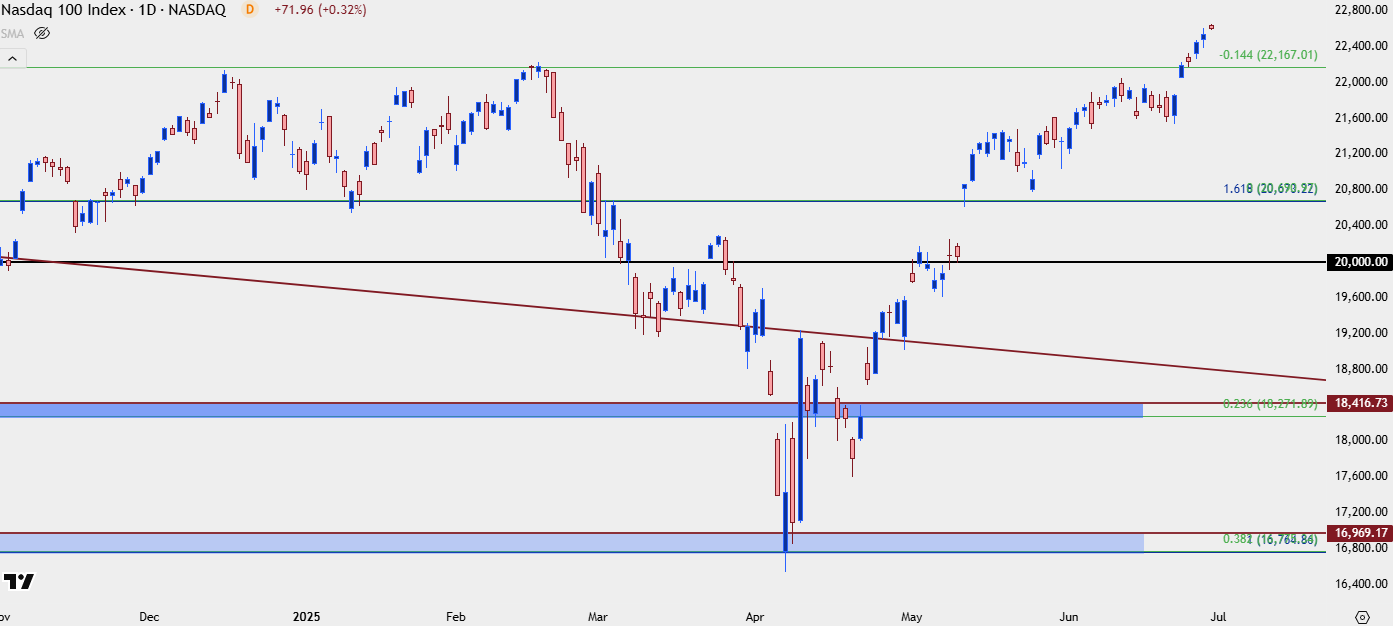
Chart prepared by James Stanley; data derived from Tradingview
As noted above, I remain bullish on U.S. equities even if I don’t love the current posture of the chart(s). This is a tough spot for a technical trader as the fear of missing out can fast override the desire for patience and precision. But, it’s a necessary trait as markets can display irrationality on both sides of the bid/ask spread.
I look at the Nasdaq as a more volatile version of the S&P 500 and that can be illustrated by the current ~36% rally in NDX against the ~26% rally in SPX. But, correspondingly downside can also be larger, as evidenced by the peak drawdown of -25.56 in NDX in the Q1 lows compared to the -21.35% peak downside move in SPX.
This will usually mean that my support and resistance levels are a bit wider in NDX than SPX, and that’s the case in the current backdrop.
The first support level that I’m tracking into Q3 is a nearby level of resistance-turned-support at 21,611, after which a Fibonacci extension shows at 20,673. That’s an important price, as this is the 161.8% projection of the 2022 drawdown and it’s also the level that caught the highs last July ahead of a 15% pullback. This price also marks the top of a gap from Q2 trade when bulls were taking over, on the way to fresh ATHs, with that gap extending down to the approximate 20k psychological level.
That becomes a major decision point for the index in the second-half of the year. If bulls fail to hold that, it would seem quite possible that something has shifted in the backdrop, either with surprisingly high inflation readings or a tougher stance on tariffs from President Trump; or possibly some surprise geopolitical factor that causes a flare in oil prices.
At that point, I look to the same deeper supports from the prior forecast at 18,271-18,416 and then 16,764-16,969.
Nasdaq 100 Weekly Chart
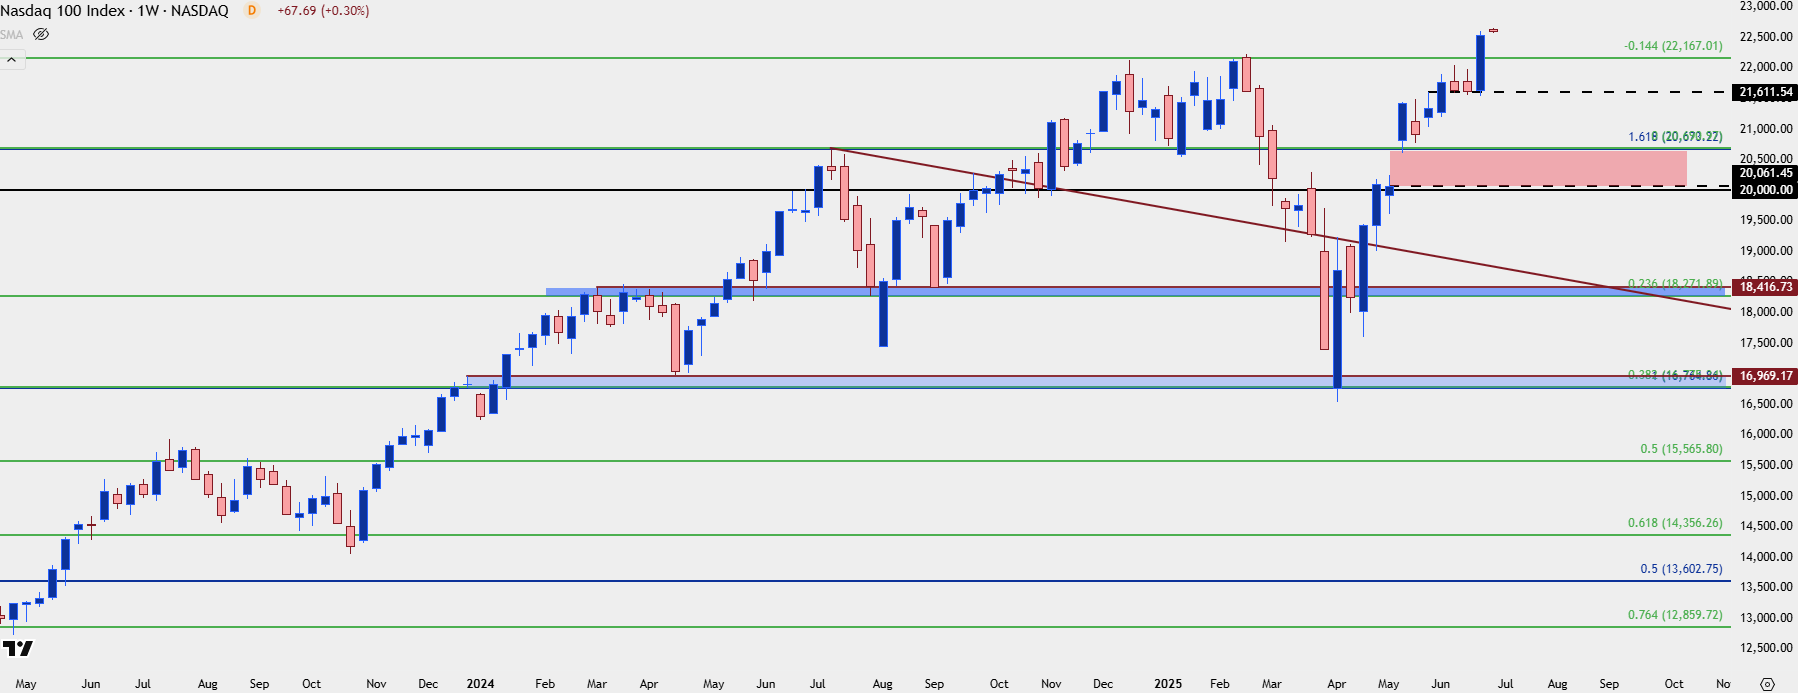
Chart prepared by James Stanley; data derived from Tradingview
--- written by James Stanley, Senior Strategist