

The build and breakout of the ascending triangle in the US Dollar was textbook, as the close two weeks ago had the DXY basket finishing the week at the bullish trendline and the next weekly open followed with a massive move-higher.
Along the way, the simple association showed across headlines, with risk aversion driving both USD strength and equity weakness as a result of higher oil prices that would both hamstring US corporates while pushing the Fed away from lower rates.
But the reality is that there’s a conduit in there, and perhaps the more clear relationship is oil-vulnerable economies like Europe or the UK or Japan getting hit harder on the premise of higher oil prices, which then prodded weakness into those currencies and, in-turn, brought strength to the DXY basket.
As markets continue to hold a cautious state of unease around the Strait of Hormuz, the Dollar has remained bid as the pullback to support yesterday found a similar response as what showed last week at the 98.73 level in DXY.
US Dollar Daily Price Chart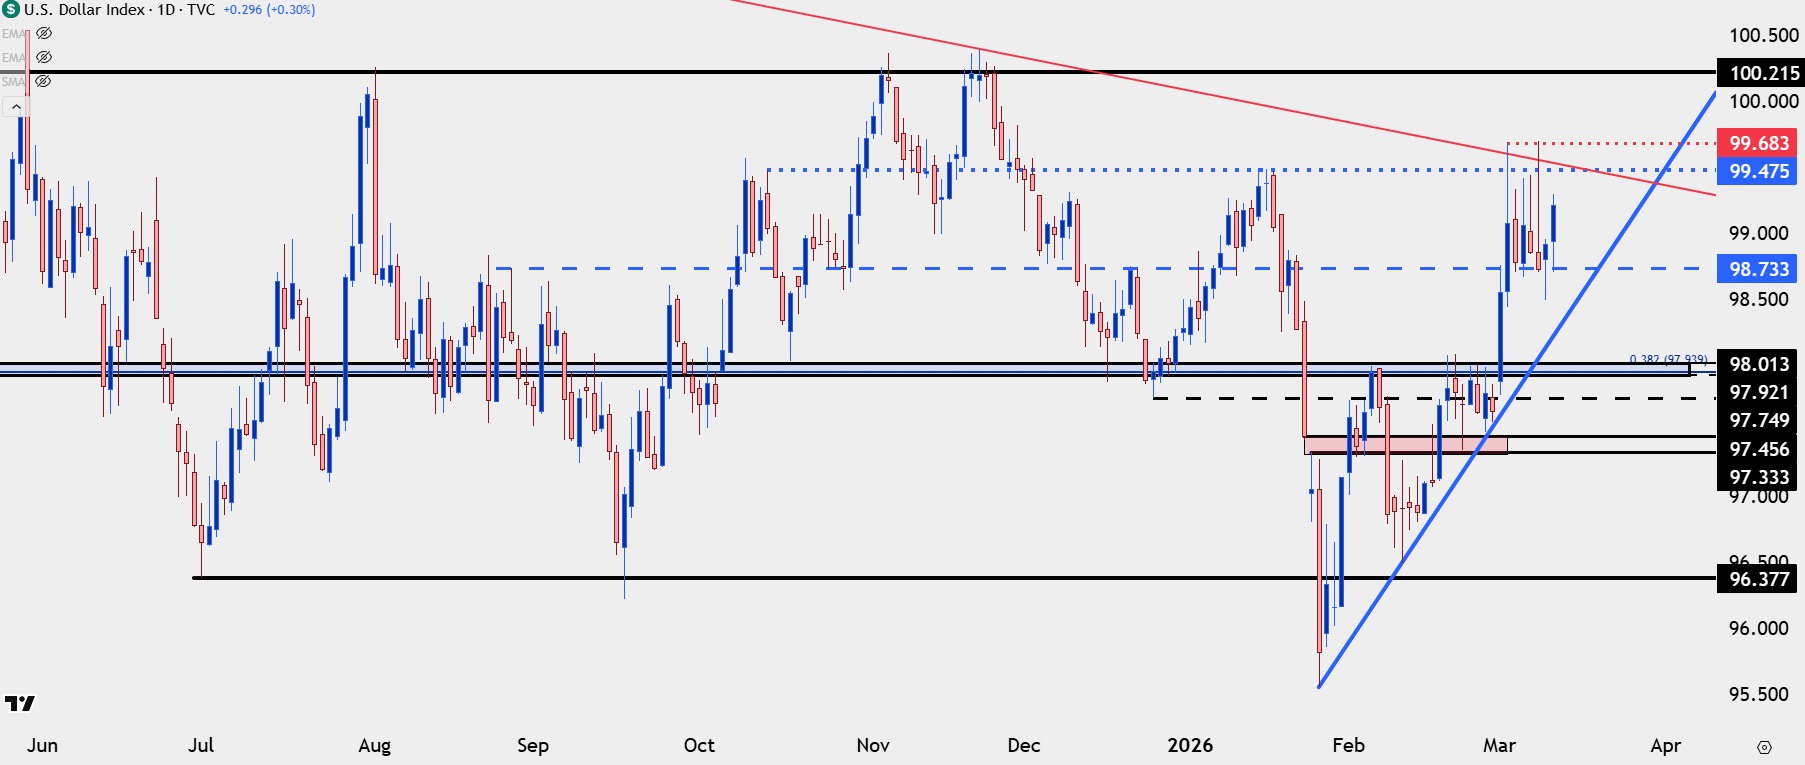
Chart prepared by James Stanley; data derived from Tradingview
USD Resistance Overhead
You can’t blame USD bulls for not trying…
They are working against a lot, to be sure, as President Trump has been clear in that he wants to see a weaker US Dollar and that’s been a constant since his inauguration last January. That drove a strong move from the 110.00 handle in DXY and since breaking below 100 last May, that’s been somewhat of a line-in-the-sand for bulls ever since.
There’s been three separate tests and failures for topside breakouts there, and at this point, I would even make the suggestion that the heaviness of that level has already reared its ugly head, as buyers have been unwilling to push too far above the resistance at the 99.50 level.
But, tying these strings together it seems as though a continued bullish push in oil can bring with it a test and perhaps even a breakout in the USD, which would have some collateral impacts like USD/JPY testing above 160.00 and EUR/USD below 1.1500.
I want to say that these are both possible events but from where we’re at now, it does seem unlikely; but given the volatility potential of what’s behind the push any type of surprise or unexpected development around the Strait could produce that. At this point it wouldn’t even take a black swan to trigger a 100-break, even a gray swan could do it. And the repercussions of that could be heavy as we would likely be looking at WTI above 100 and equity prices pushing to fresh lows – both events that I think would get President Trump even more active in the headlines in the effort of turning matters around.
US Dollar Weekly Chart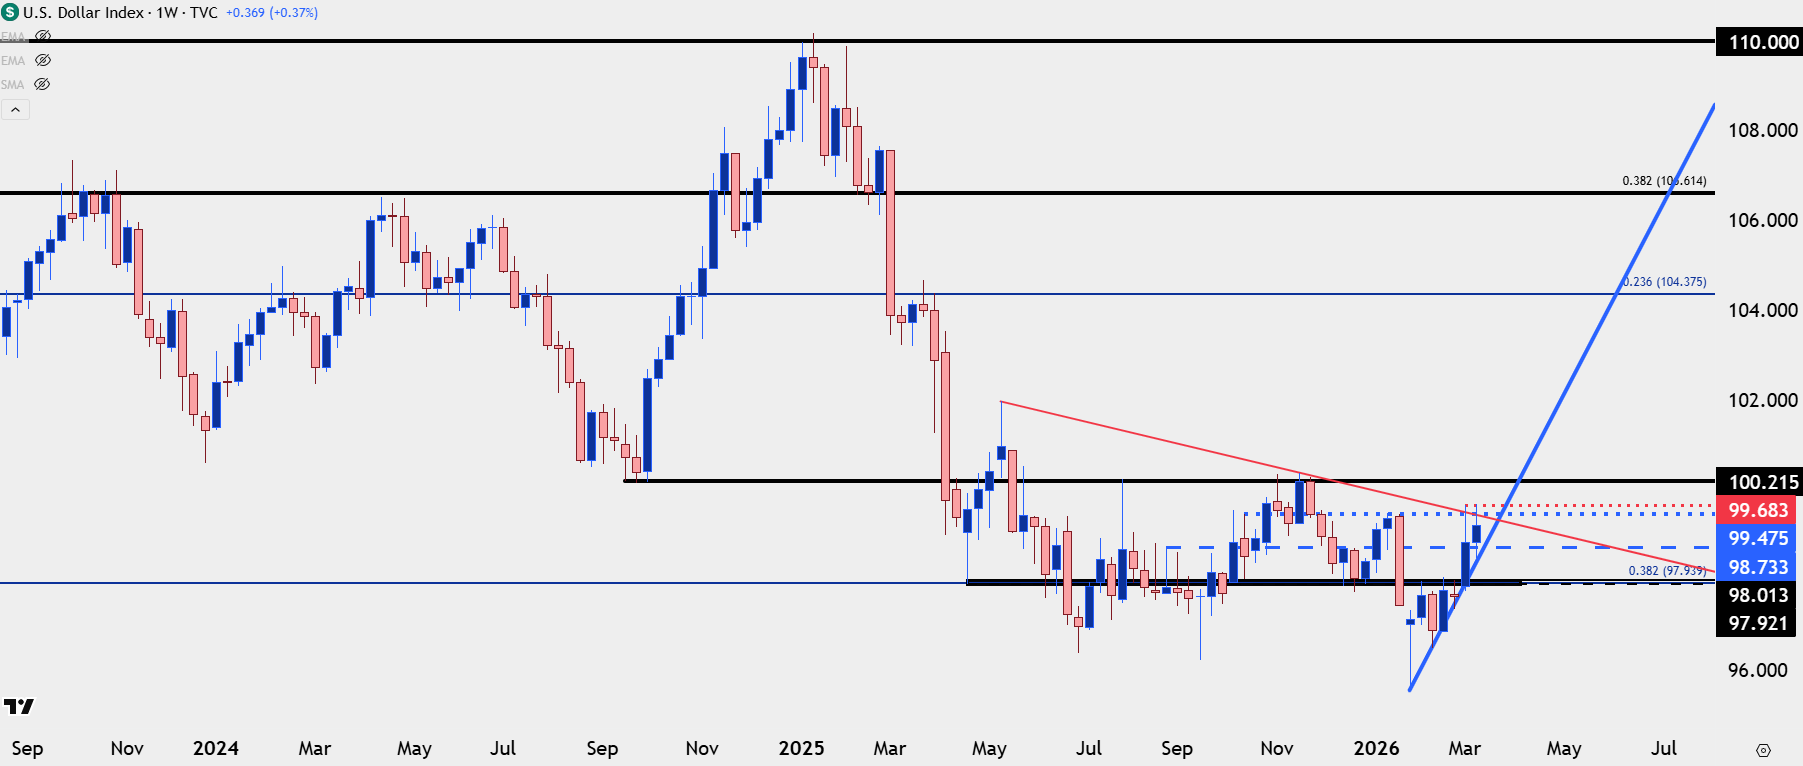
Chart prepared by James Stanley; data derived from Tradingview
EUR/USD
FX is unique as a trading instrument and I think this often gets lost in the shuffle amongst many retail traders. There’s an actual underlying need for currency and when we have a pair like EUR/USD, there’s many market players that may not be as interested in short term speculation and, in-turn, can given a stronger impact to major psychological levels.
I’ve told this story around the 1.1500 level for the past half-year, and from the weekly chart below, we can see how this price has historically taken time to leave behind, even when there was a concerted fundamental bias in the matter.
If you think of it from the perspective of a corporate treasury department it can make sense as to why. When EUR/USD rallies from 1.0500 up to 1.1500 in a few months, the Euro suddenly feels expensive, and the USD cheap. That company may need to make payroll in the States in the coming months and that 1.1500 marker makes it seem an opportune time to swap some Euro reserves for USD. That very act of selling Euro and buying USD helps to reinforce the 1.1500 resistance and then price dips down until, suddenly, Euro feels cheap and the Dollar expensive, such as we saw around 1.0500 back in the 2015-2017 range.
EUR/USD Weekly Chart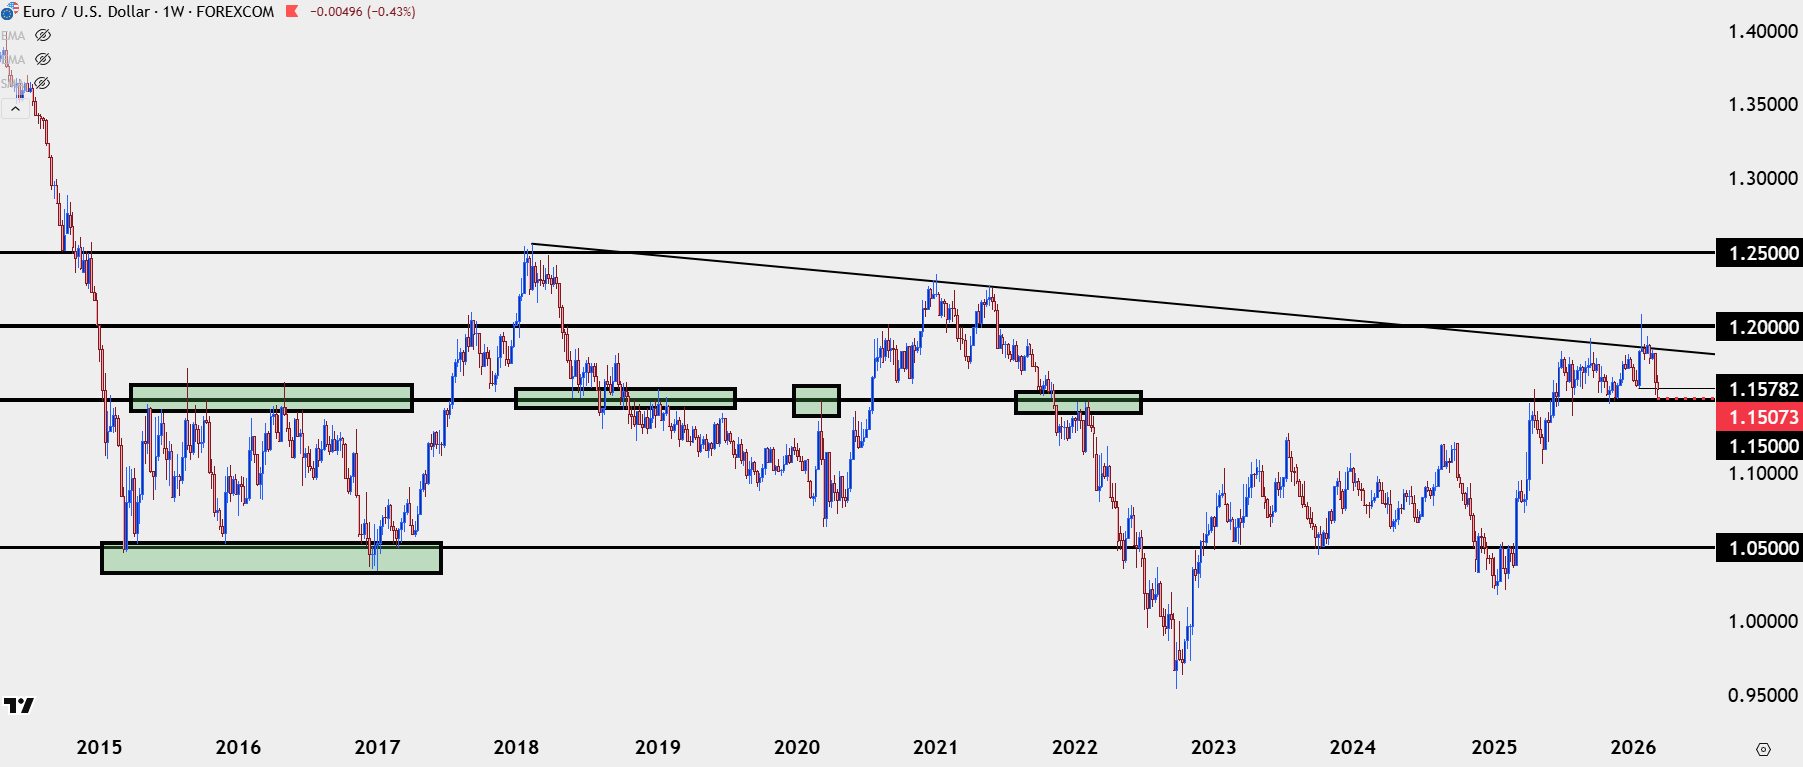
Chart prepared by James Stanley; data derived from Tradingview
From the above chart you’ll notice that there can be breaches beyond these major psychological levels, but it’s when they do hold as support or resistance that the potential for asymmetry shows, and of late, it’s been the 1.1500 level that sellers haven’t been able to do much below in EUR/USD and we came very close to another test of that price earlier this week, when we had the flare-higher in oil prices and the rally in the USD.
The reason that this matters is it was the 1.1500 level that buyers came in ahead of for this week’s low, and from the underside wicks on the daily candle for the past week and change, it’s clear that that’s been a line in the sand that bears have not yet wanted to cross. Interestingly this has happened even as the ECB has sounded relatively-hawkish, in part, due to those higher oil prices.
This can make for a compelling reversal scenario as the pair continues to dance around that major psychological level.
EUR/USD Daily Chart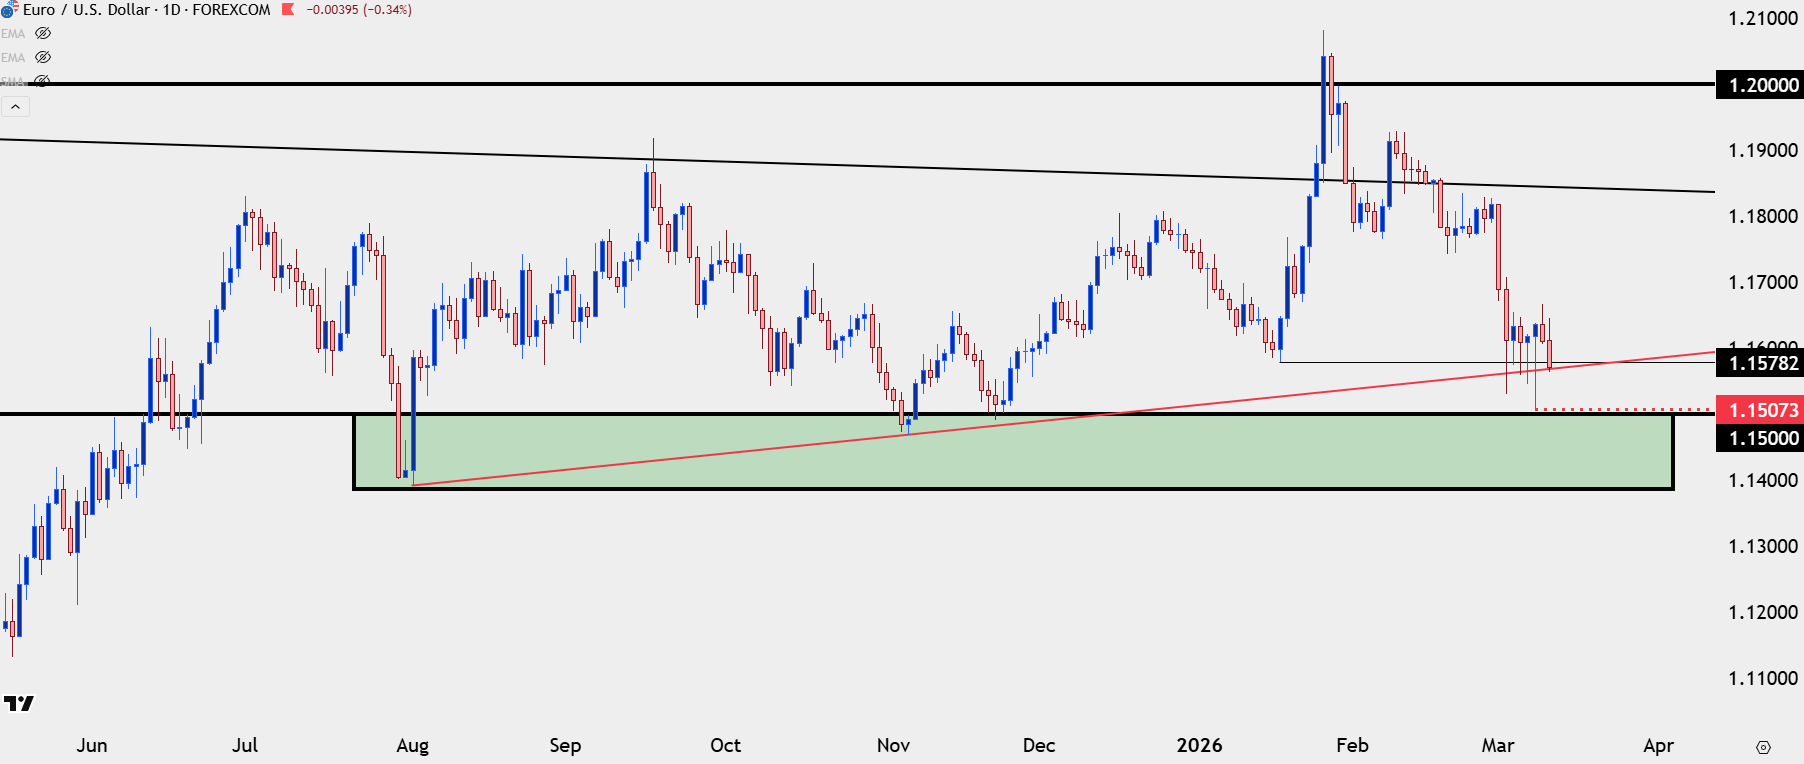
Chart prepared by James Stanley; data derived from Tradingview
USD/JPY
USD/JPY is back at that same 158.88 level and as I’ve been writing, the pair can remain attractive on pullbacks but chasing breakouts remains a challenge. The 160.00 level is the obvious line-in-the-sand and like EUR/USD with 1.1500 above, it seems that we would need to see an increase in Middle East tensions and in-turn the price of oil to make that scenario come to fruition.
That said, the bullish structure looked at in Monday’s article remains in-place, and a pullback to and hold of support at 157.97, 156.76 or 155.54 remain of interest for continuation strategies.
USD/JPY Four-Hour Price Chart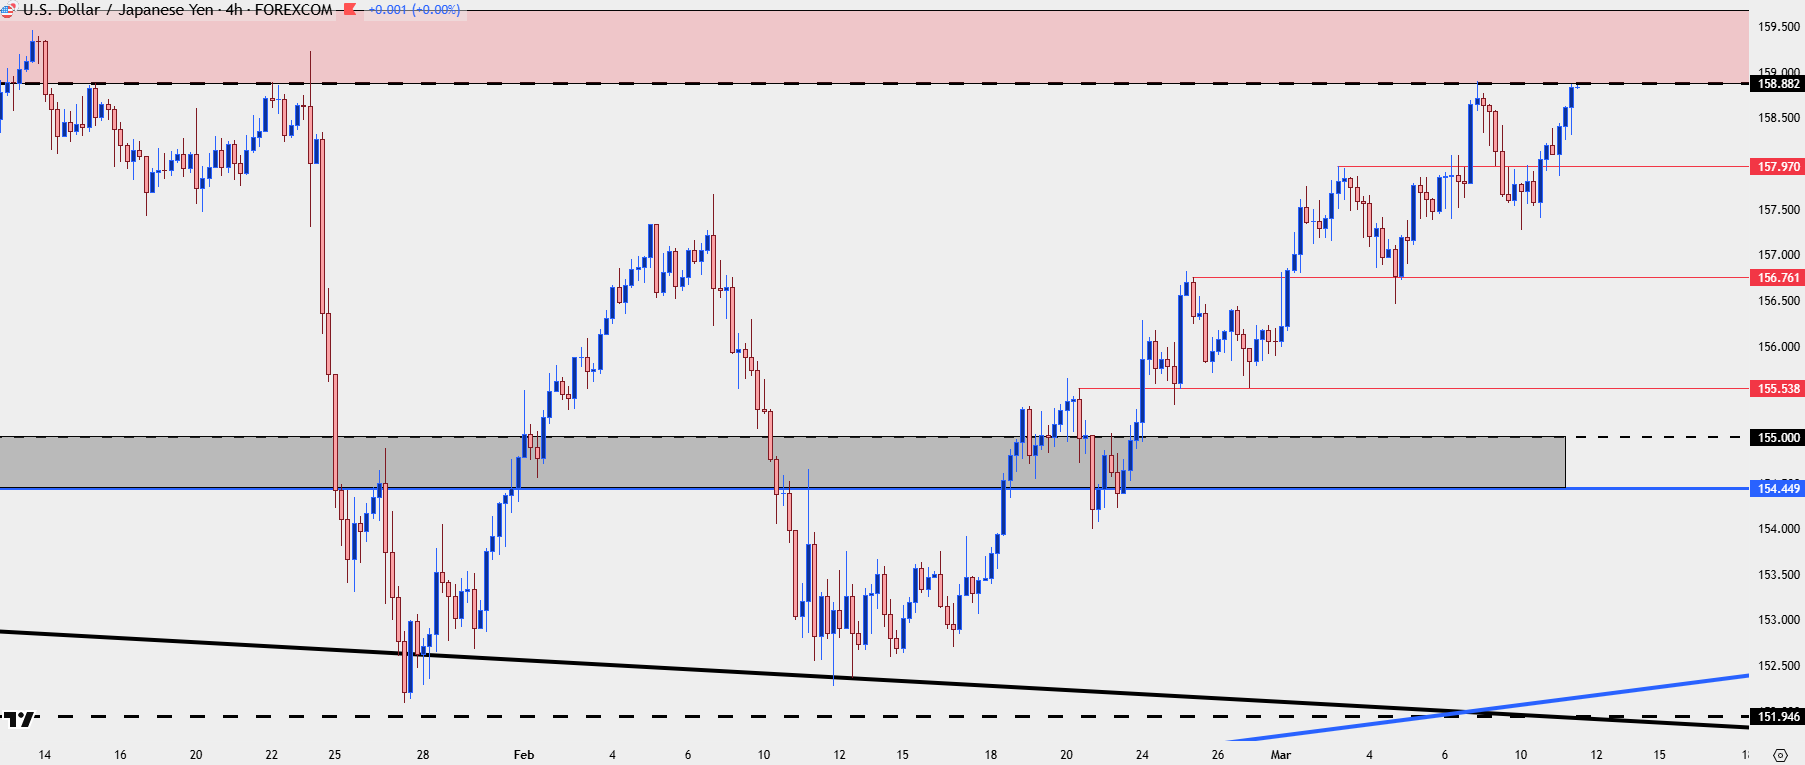
Chart prepared by James Stanley; data derived from Tradingview
--- written by James Stanley, Senior Market Analyst, Global Macro