
The prior week’s USD weakness was largely erased over the past week as the DXY basket returned to a massive spot of long-term interest on the chart. The 97.94 Fibonacci level came into play back in April of last year and led to a bounce in the USD after a decisive sell-off had hit in the early part of 2025. Sellers were eventually able to get below that price but for the rest of the year they weren’t able to do much below it, with that level coming in as resistance and then support in December.
Early-2026 trade brought another breakdown test but, again, sellers couldn’t do much below even with an open door after a fresh multi-year low. But the pullback from those oversold conditions have led to a rally and re-test of this key level on the chart.
US Dollar Weekly Price Chart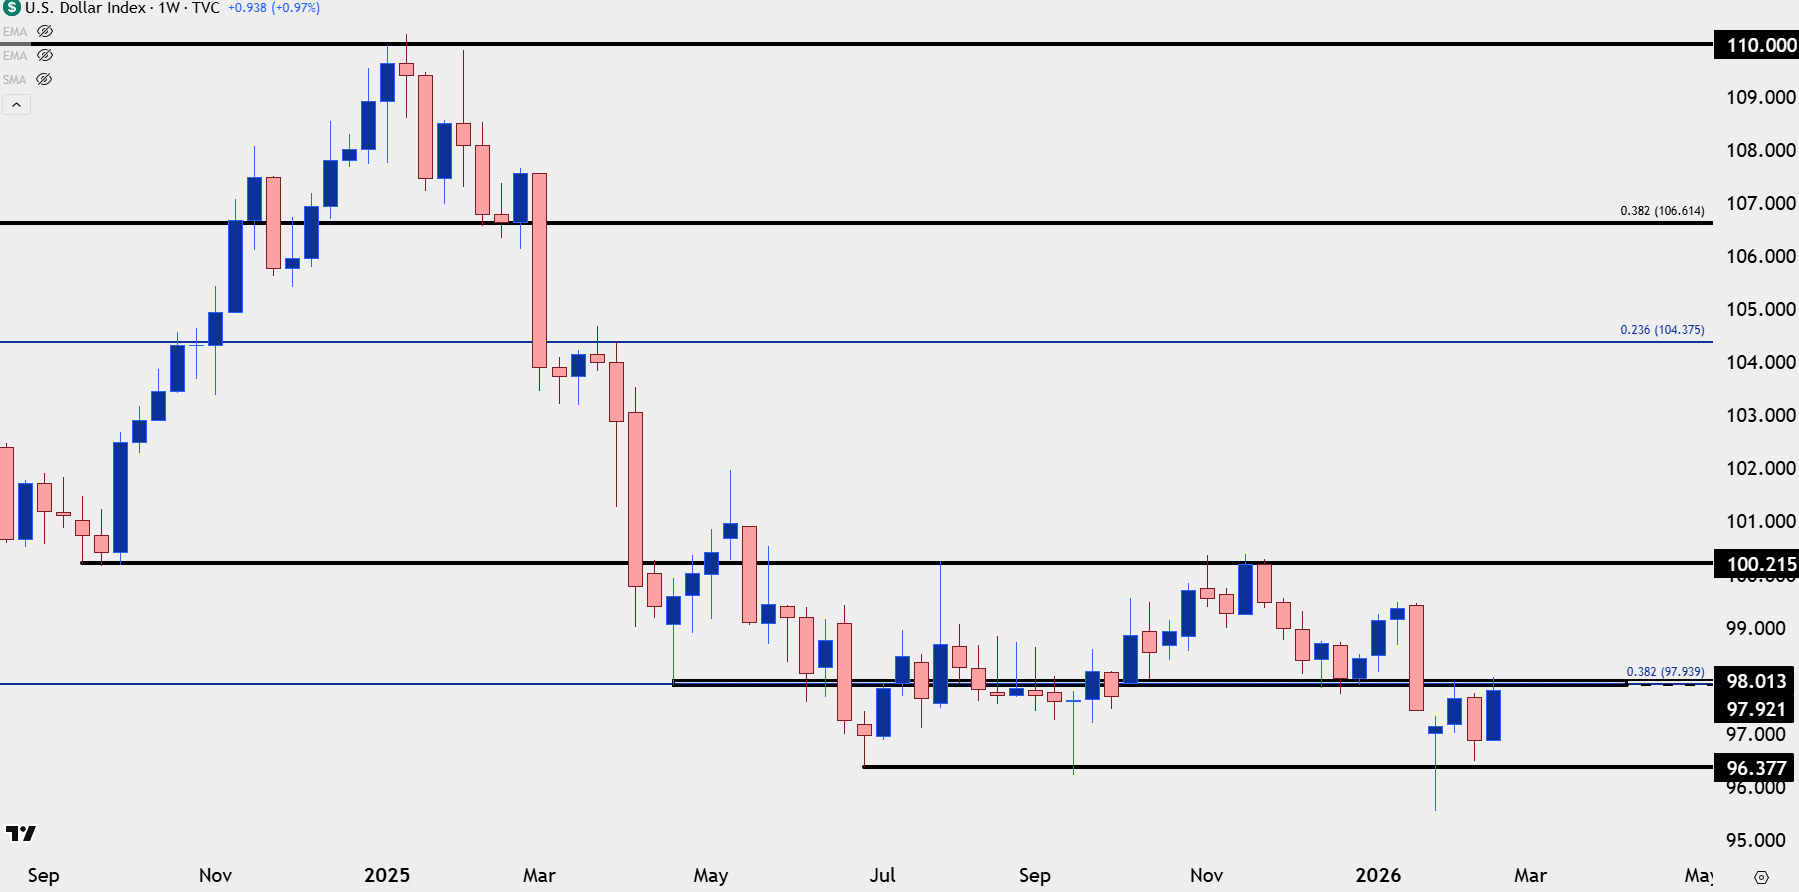
Chart prepared by James Stanley; data derived from Tradingview
USD Daily
From the daily chart there’s an ascending triangle formation in-play with the multiple tests of resistance at prior support, along with the higher-lows from that oversold reading in late-January.
This provides some bullish scope although as I’ve been writing, I think the question behind drivers goes right back to the Japanese Yen and the built-in long position for the carry trade. If we do see signs of unwind, whether that drive is exogenous from intervention or organic via positioning paring back, I think the DXY basket will follow the trajectory of USD/JPY regardless.
This is one reason, after all, that USD went as oversold as it did on the daily chart in late-January, which was the most oversold for the currency in more than five years as I shared on the webinar as it was happening.
US Dollar Daily Chart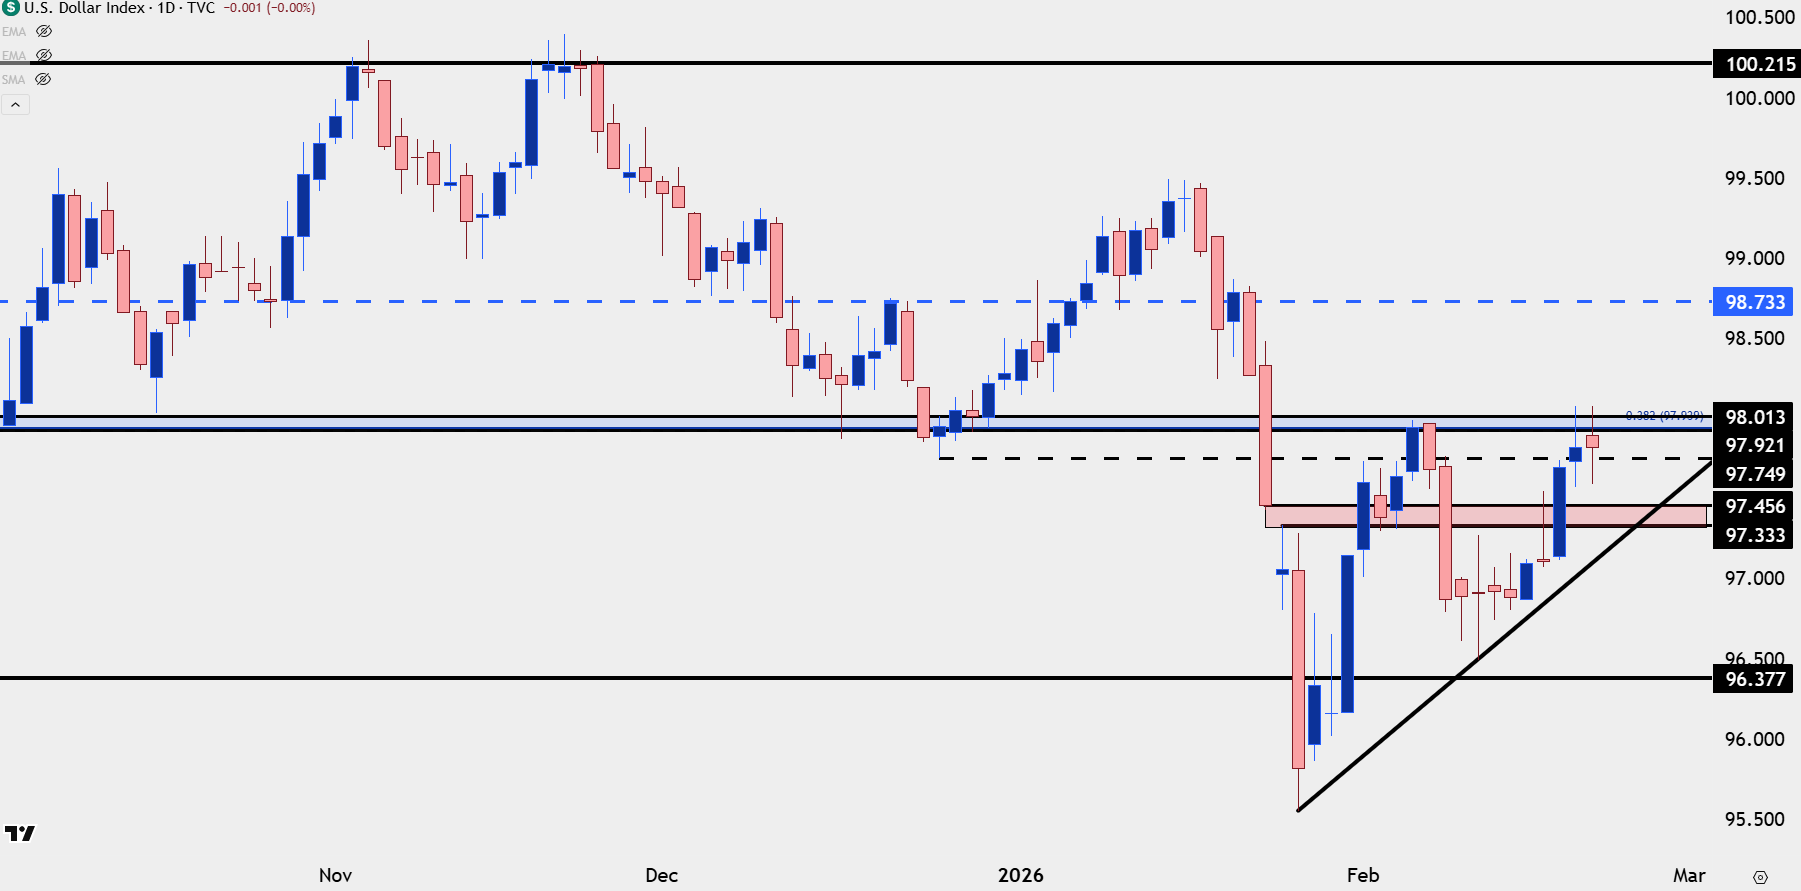
Chart prepared by James Stanley; data derived from Tradingview

USD/JPY
I remain of the mind that USD/JPY is the most important driver for the DXY basket at the moment, and a chart I shared in the Thursday article explains why. The Japanese Yen remains remarkably weak on a five-year horizon against the USD, Euro and British Pound and if it weren’t for that JPY weakness, the DXY basket would probably be a lot lower at this point.
And one of the driving factors to the USD sell-off we saw in late-January was the sizable sell-off in USD/JPY, which many were attributing to intervention. I remain skeptical of that cause for that incident although what we saw in the previous week seems more suspect to me. The Sanae Takaichi election win was widely believed to be a USD/JPY bullish driver which initially showed, only for the pair to be slammed lower shortly after. And then the NFP print on the following Wednesday was strong by all accounts and, again, this would be expected to be a bullish driver in USD/JPY.
Instead we saw a brisk bearish reaction when price tested resistance and sellers pushed all the way down to 152.50.
Since then, however, and over the past week, bulls have been recovering. As we wind into the end of the week there’s another test at 155.00 and as I’ve been saying for a while now, I remain cautious of chasing upside momentum here. But pullbacks and holds of support can remain a constructive way to establish bullish exposure, even if only for short-term setups.
But if we are to see a larger USD-recovery I think we’re going to need to see USD/JPY grind closer towards the 160.00 handle that it’s been reticent to test ever since the intervention saga of July 2024.
USD/JPY Four-Hour Price Chart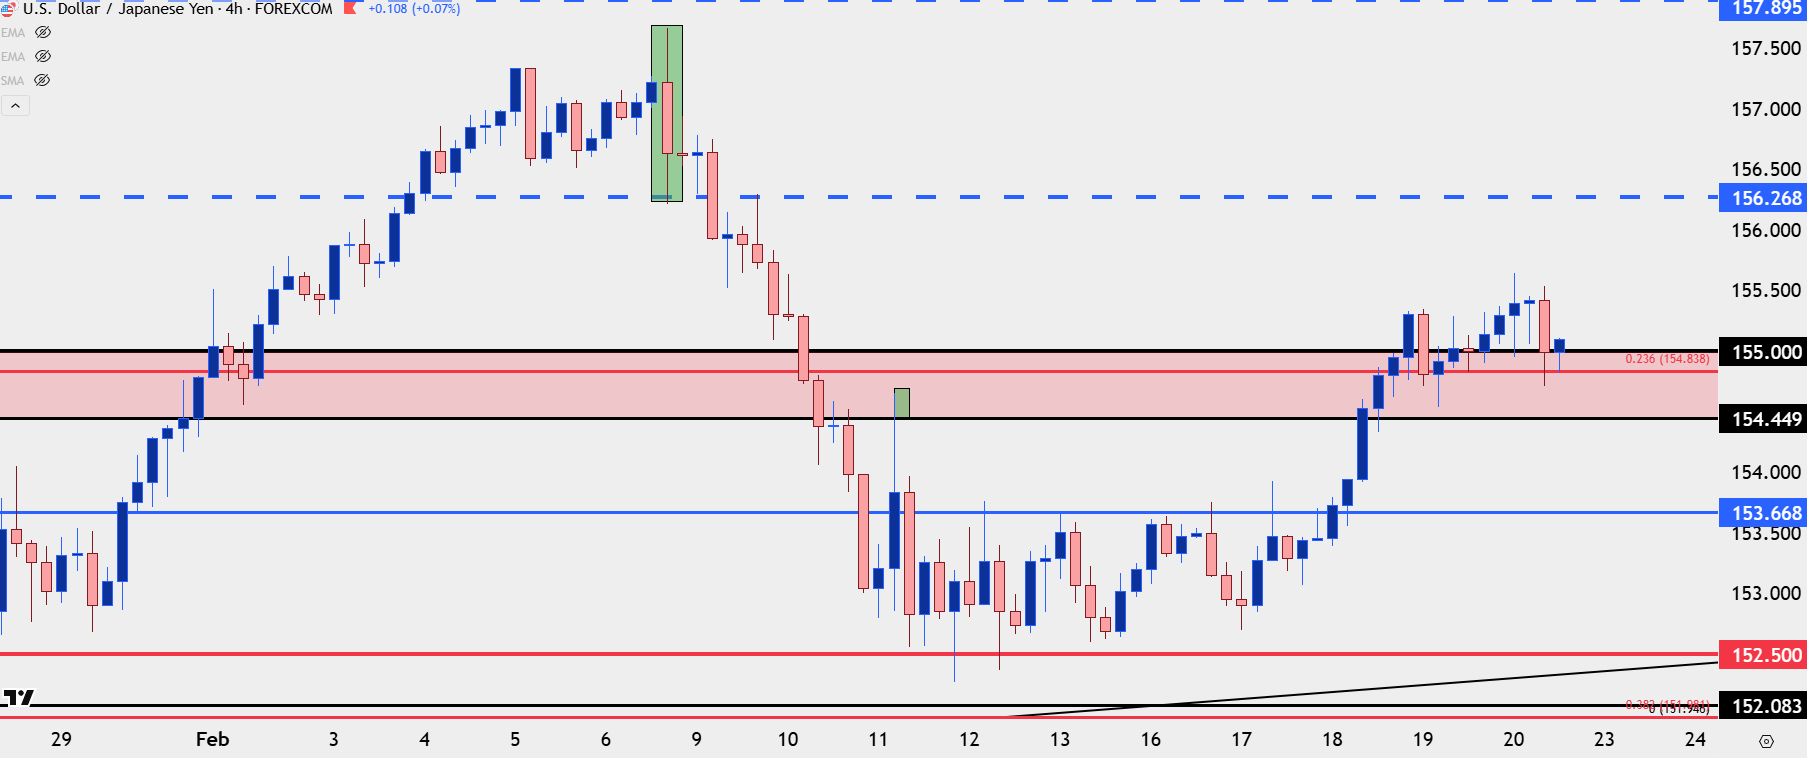
Chart prepared by James Stanley; data derived from Tradingview

EUR/USD
It’s strange to think that the 57.6% component of the DXY basket might just be along for the ride with larger Yen themes but, again, history and charts spell it out. We saw this in July of 2024, around that intervention episode that sent the USD/JPY pair spiraling lower. At the time there really wasn’t much great in the Eurozone, but the pair rallied up to a fresh high, eventually finding resistance at 1.1212 anyways. This was clear illustration of the USD-weakness emanating from carry unwind also showing in EUR/USD and like we’ve seen reiterated over the past month, similar dynamics remain in-play.
It was when we had that rush of USD-weakness in late-January, right around the BoJ meeting, that EUR/USD pushed above 1.2000 and went overbought on the daily chart.

Despite the fact that the larger backdrop might be driven by indirect factors, price levels still matter, as we’ve seen over the past couple weeks in EUR/USD.
There was a clean hold of resistance at the 1.1909-1.1919 zone, followed by pullback. And then there’s the support test at 1.1748 which is a long-term Fibonacci level of note. The bounce from that ran as high as 1.1805 on Friday followed by pullback, but that remains a key level as we move into next week. There’s deeper support context at 1.1717 and 1.1686, which is another Fibonacci level on the long-term setup that I wrote about a year ago right around when EUR/USD was establishing its bottom.
EUR/USD Daily Chart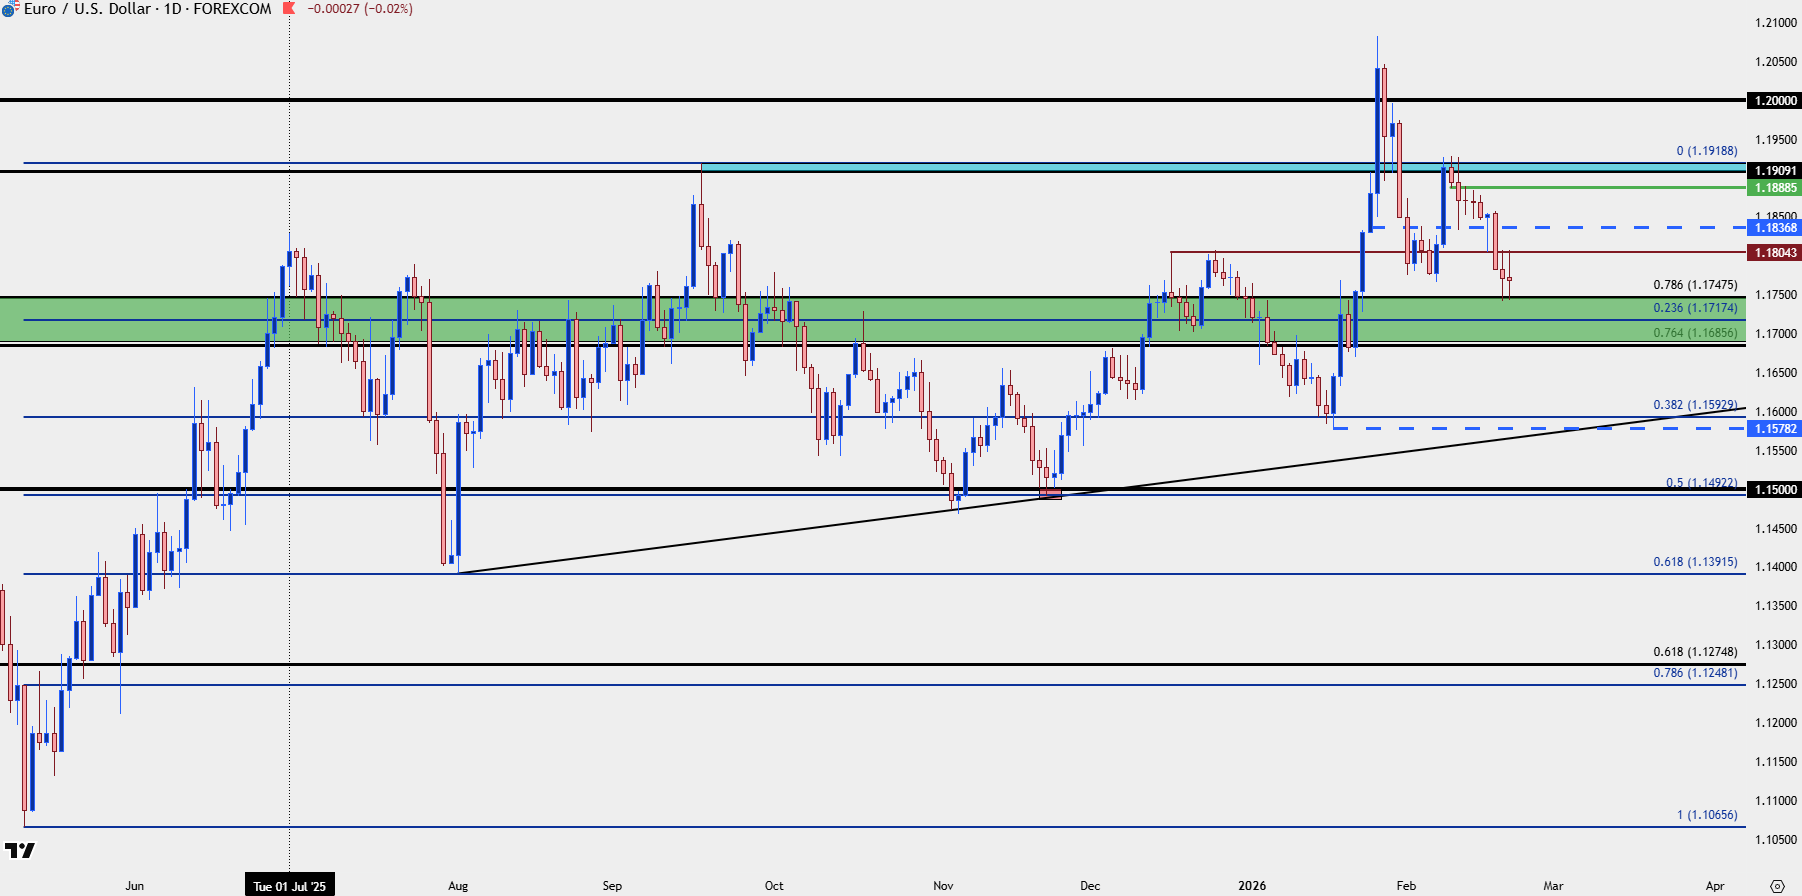
Chart prepared by James Stanley; data derived from Tradingview
USD/CAD
For USD-strength strategies USD/CAD might be a cleaner setup than USD/JPY above, and I’m largely just going off of recent structure. I wrote about this on Thursday but the 1.3500 support hold speaks to the longer-term mean-reverting nature of the pair and a recent higher-low with defense above that price keeps the door open for bulls to make a forward push. The 1.3727 level is a familiar spot as that produced a double bottom formation last year, and so far, that’s been the line in the sand for bulls. But if buyers can muster a break above that then there’s an open door for a run up to 1.3925 and perhaps even a re-test of the 1.4000 handle.
USD/CAD Daily Chart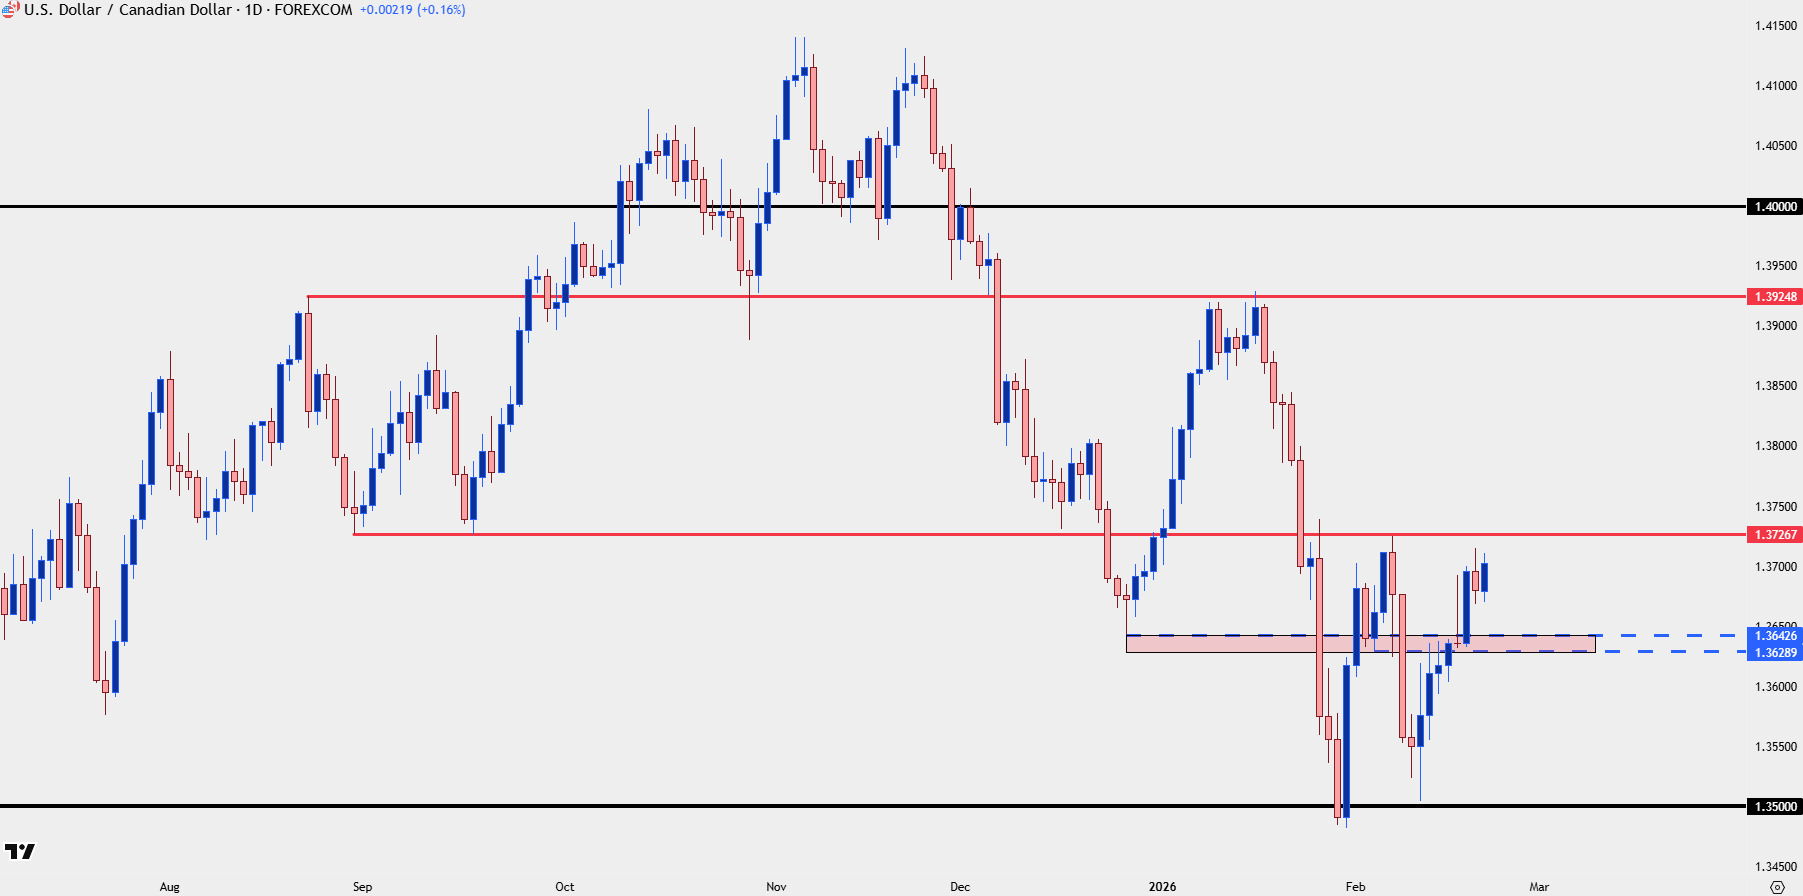
Chart prepared by James Stanley; data derived from Tradingview
Gold
I wanted to include gold in this week’s US Dollar write-up as I think this is one way to take a different approach towards the USD and the USD/JPY carry theme. The longer-term backdrop in gold suggests consolidation given the splash hit from a few weeks ago, but with a few hours to go into the end of the week buyers are making an important push that showed the potential for trend resumption on bigger picture charts.
Gold Weekly Chart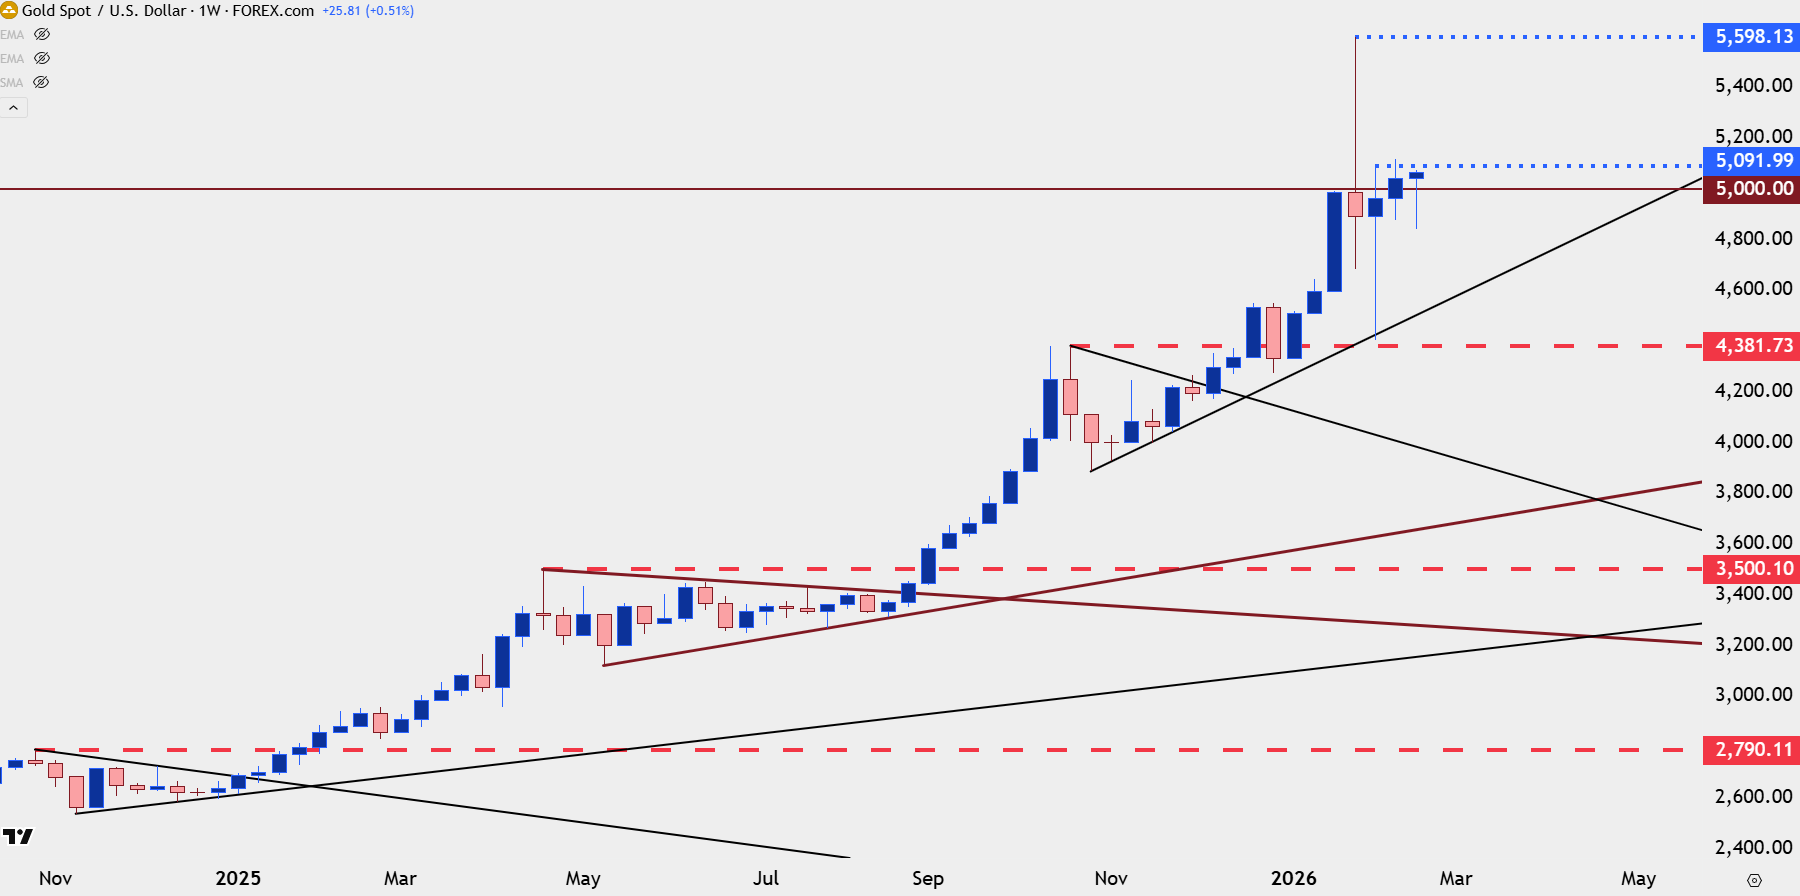
Chart prepared by James Stanley; data derived from Tradingview
Gold Strategy – 5100
It’s the 5100 level that stands out as an important waypoint here. This was a spot of support-turned-resistance and over the past few weeks, that’s been the resistance zone that buyers haven’t been able to leave behind.
This sets up an ascending triangle formation given the horizontal resistance and higher-low support, and that keeps the door open for bullish breakout potential into next week.
Gold Four-Hour Price Chart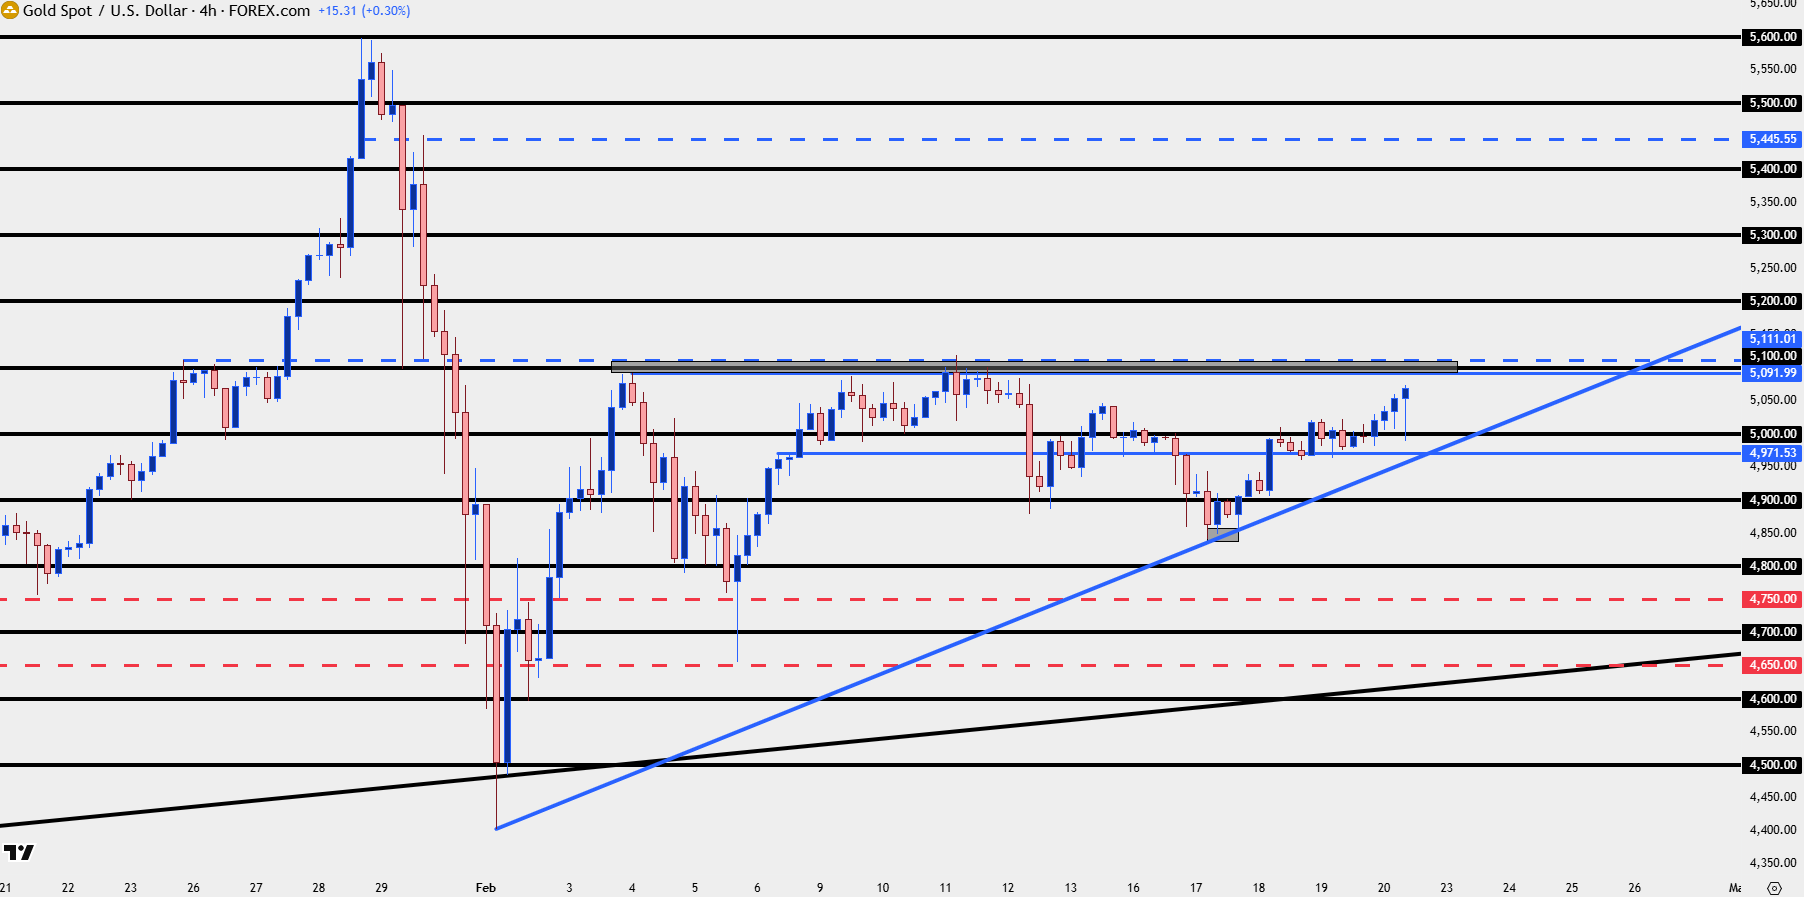
Chart prepared by James Stanley; data derived from Tradingview
--- written by James Stanley, Senior Market Analyst, Global Macro