
- US yields retreat, but dollar holds firm
- Rising equity volatility may explain dollar resilience
- AUD/USD more susceptible to equity volatility shifts
- Nvidia reaction puts potential reversals in focus
The US dollar has been in a tear lately, propelled higher by last week's aggressive hawkish repricing of the Fed interest rate outlook. But the forces behind the rally may now be starting to shift. US yields have retreated from their highs, but the dollar has not followed, suggesting elevated risk aversion and associated safe-haven flows may be providing support for now.
Having surged to fresh 2026 highs, the question now is whether the dollar's rally has legs. On Tuesday, ahead of Nvidia's Q3 earnings results, doji candles appeared across several major currency pairs, including AUD/USD and EUR/USD, signalling rare indecision among traders following strong bear moves. With a sparse economic calendar on Wednesday, Nvidia's results and the subsequent market reaction could determine whether these early signs of a potential reversal develop into something more substantial.
US yields retreat, but dollar holds firm
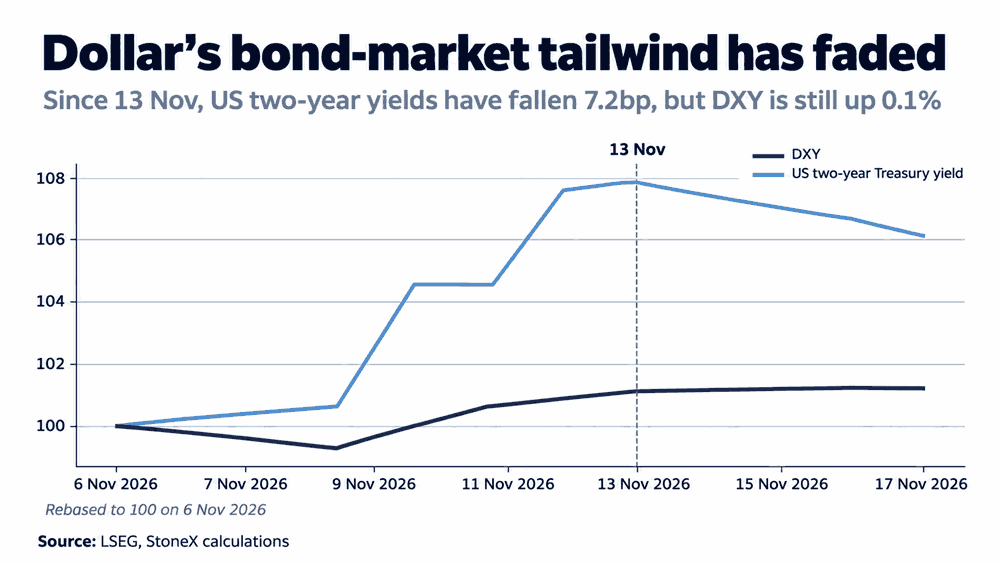
The dollar's surge last week to levels not seen since the Liberation Day tariff tantrum in April 2025 coincided with a dramatic hawkish shift in US interest rates, as discussed in previous analysis. Between 9 and 13 November, two-year Treasury yields surged 32.7 basis points, while one-year USD OIS pricing jumped 28.7 basis points. That hawkish recalibration fuelled the dollar, with DXY gaining 1.73% as markets priced in nearly two additional rate hikes by the end of next year.
Source: LSEG
However, that relationship looks to have shifted this week, although the evidence remains tentative at this stage. Since Friday's close, two-year Treasury yields have fallen 7.2 basis points, while one-year and two-year USD OIS pricing, which tracks average market expectations for overnight rates over those periods, has declined 7.2 and 9.8 basis points respectively. Yet the dollar has not pulled back in line with yields, instead edging 0.13% higher over the same period.
Risk aversion may be keeping dollar supported
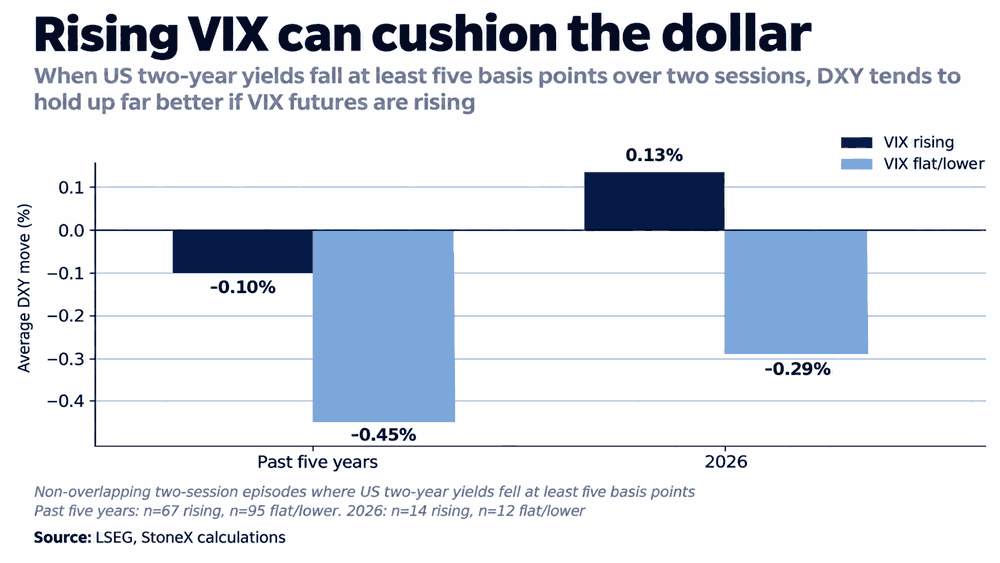
One possible explanation for that divergence is elevated risk aversion, centred primarily on the AI sector, which has contributed to a sharp increase in equity market volatility. Front-month VIX futures have surged around 25% since Friday's close, potentially explaining why the dollar has held up despite the pullback in US yields.
Source: LSEG
Historical evidence loosely backs that suspicion, with the graphic above showing the dollar typically holds up far better when US yields are falling but implied equity volatility is rising. With nothing major on the economic data calendar today, that puts the emphasis on Nvidia's earnings update, particularly the earnings call, and the subsequent market reaction when it comes to determining the dollar's next move.
Sentiment takes centre stage
With little on the US economic calendar likely to shift interest rate expectations, Wednesday looks set to be driven primarily by sentiment. Australia's September-quarter wage data has barely moved the Aussie in years, while the final October euro area inflation figures rarely deliver meaningful surprises. Neither looks likely to have much influence on AUD/USD or EUR/USD.
Beyond Nvidia, the next major test of sentiment will come from Anthropic's blockbuster IPO, expected to price on Wednesday ahead of its Nasdaq debut on Thursday.
Of the two currency pairs, AUD/USD has been more susceptible to shifts in equity market volatility. That suggests the Aussie may be better placed than the common currency to benefit if Nvidia's results help calm nerves about the AI capex buildout, especially if US yields fail to rebound alongside an improvement in risk appetite. Equally, if risk aversion intensifies, the Aussie may be more vulnerable to further selling than the euro.
AUD/USD Technical Analysis
Source: TradingView
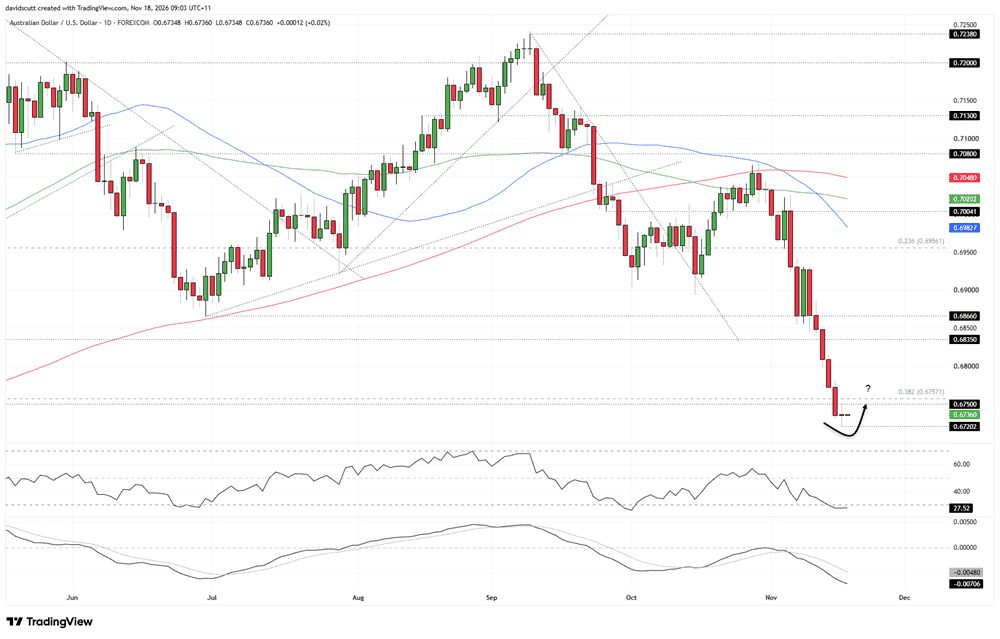
The Aussie has been absolutely belted in November, sliding from above 70 US cents into the low 67-cent range, taking out several important levels along the way, including the 38.2% Fibonacci retracement of the April 2025 to May 2026 bull move. However, with RSI (14) showing signs of bottoming in oversold territory and a doji candle printing on Tuesday's daily chart, there are tentative signs that traders are reassessing whether the sell-off can extend.
That puts the emphasis firmly on Wednesday's price action. A close above 0.6750, a level that has acted as both support and resistance at various points in recent years, would complete a three-candle morning star reversal pattern. The 38.2% Fibonacci retracement sits just above, providing another potential obstacle for buyers. Following such a pronounced downtrend, completion of the pattern may bolster confidence that a larger reversal is underway, putting 0.6835 and 0.6866 into play.
Alternatively, a break beneath the overnight low of 0.6720 would reinforce the prevailing bearish bias, putting the emphasis on 0.6660 initially, a level that acted as both support and resistance around the turn of the year.
EUR/USD Technical Analysis
Source: TradingView
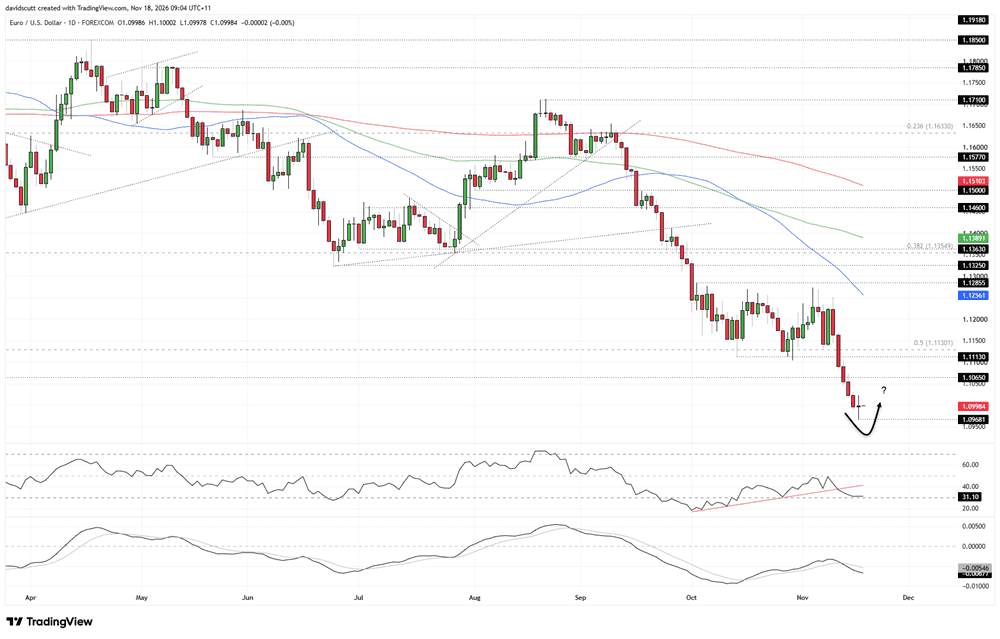
EUR/USD sits in much the same camp as AUD/USD, having fallen to its lowest level since April 2025 earlier this week. However, it too printed a doji on Tuesday's daily chart, completing two-thirds of a potential morning star reversal pattern. Again, that puts the emphasis firmly on Wednesday's price action.
The story from the oscillators remains bearish, with RSI (14) sitting just above oversold territory, having broken the uptrend that had been in place throughout much of October. MACD also remains beneath its signal line in negative territory, suggesting downside momentum remains in the ascendancy.
For a morning star reversal to be completed, EUR/USD would need to close at least above 1.1010, roughly the midpoint of Monday's bearish candle, although a more pronounced rebound would provide greater confidence in the signal. If that were to occur, levels to watch overhead include 1.1065 and 1.1113, both potential targets should a larger recovery develop.
Alternatively, a break beneath Tuesday's low of 1.0968 would reinforce the broader bearish bias that has been in place for some time, suggesting the downtrend may have further to run.