
The US Dollar has punched up to a fresh two month high on the heels of the FOMC rate decision, with some assistance from both the Euro and Japanese Yen following ECB and BoJ rate decisions. Today’s price action has seen support at a familiar Fibonacci level of 98.98, and DXY has so far shied away from a test of the psychological level of 100 which is the next significant spot of resistance sitting overhead. With a lack of US data, the question now is whether Fed commentary following the lift of the blackout can drive trends in the Greenback.
Notably, the higher-high and higher-low sequencing that started from the Fed’s rate cut announcement in September has continued, similar to albeit more constrained than last year’s scenario.

Last year’s start of rate cuts brought a couple of unexpected factors and given the context with which those rate reductions were happening, it made sense. With the Fed moderating short-term rates last year long-term Treasury rates jumped, with the 10-year going from a pre-cut low of just below 3.6% all the way to a January 13th high of 4.8%. That’s a massive move in an important asset in a relatively short period of time, but for currency traders, that move came along with an aggressive jump of USD-strength as DXY rallied through the fourth quarter of last year.
That January 13th date was important though, because not only did the 10-year set a high yield of 4.8% that day but DXY set a fresh two-year high. At the time, optimism was surrounding the US economy ahead of President Trump’s inauguration but that slowly gave way to uncertainty as the push for tariffs took over.
Slowing economic data in March compelled a breakdown in the USD and odds for rate cuts jumped, even though the Fed refrained from leaning too dovish, saying instead that the inflationary threat from tariffs presented a wild card that they weren’t yet sure how to address. Realistically, if you look at the jump in inflation data after they cut rates last year, it seemed there was another concern and that’s the fact that inflation didn’t really seem to be tamed given how quickly it had moved up after the Fed’s rate cuts began last year. And that highlights an important point as the Fed is again cutting rates even with inflation data printing well-above their 2% target.
But, in the USD, the sell-off that took over earlier in the year has been largely stalled for the past six months, allowing for the build of a falling wedge formation.
The current three-year low for DXY printed at the announcement of the Fed’s rate cut last month, and that’s so far led in to a series of higher-highs and lows as buyers have forced a bullish break from the falling wedge, a formation often approached with aim of topside reversals.
US Dollar Daily Chart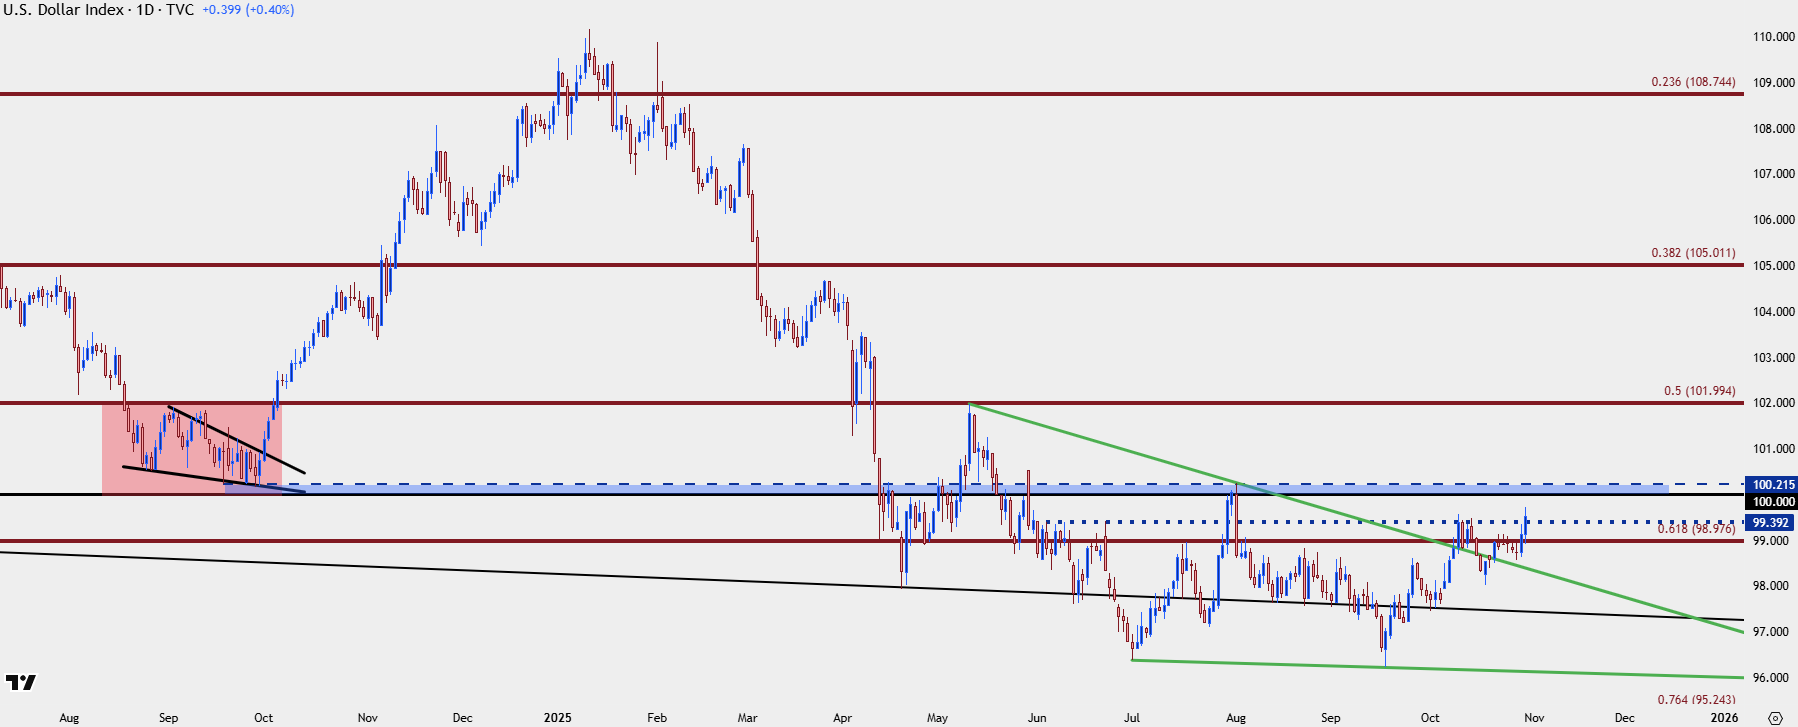
Chart prepared by James Stanley; data derived from Tradingview
EUR/USD
EUR/USD has so far held above a key spot of support, but there’s now a descending triangle formation in-play and that keeps the door open for bearish breaks.
A few weeks ago in the webinar I highlighted a double bottom formation with the low at 1.1542. So far, sellers have shied away from re-test there, but there’s lower highs to work with as seen from the descending trendline below. Next support is the 1.1500 psychological level, which is confluent with the 50% mark of the May-September rally, with 1.1392 and then the zone around 1.1275 below that.
With a bit of opacity around US data given the government shutdown, this puts more emphasis on the Eurozone CPI print for tomorrow morning.
EUR/USD Daily Price Chart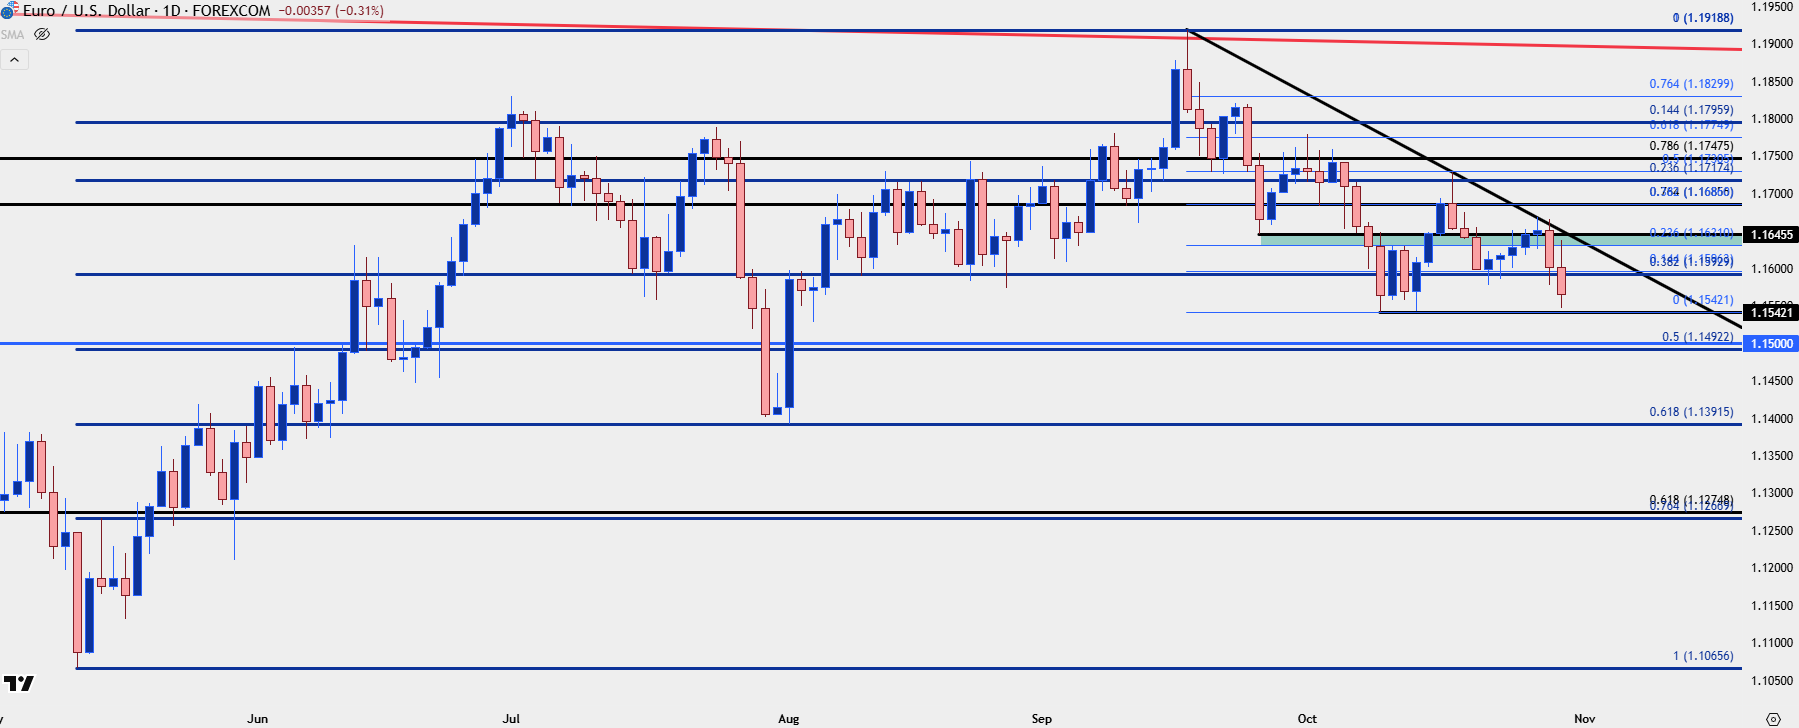
Chart prepared by James Stanley; data derived from Tradingview
USD/JPY
I’ve been highlighting USD/JPY as one of the more attractive markets for USD-strength and that hasn’t disappointed yet. I talked about this at-length in the webinar on Tuesday with focus on a support zone running from the 2022 and 2023 high of 151.95 up to the 152.18 level. That zone held support for the past two days, and with help from the BoJ meeting last night buyers have been able to stretch up for a fresh eight-month high.
There’s now resistance showing at the 23.6% Fibonacci retracement of the rally from last September to this January, and notably the 38.2% retracement of that same setup is what set support last week and then again this week. This sets the stage for higher-low support potential at the prior matched high of 153.28, and next resistance is the 155 psychological level.
USD/JPY Daily Chart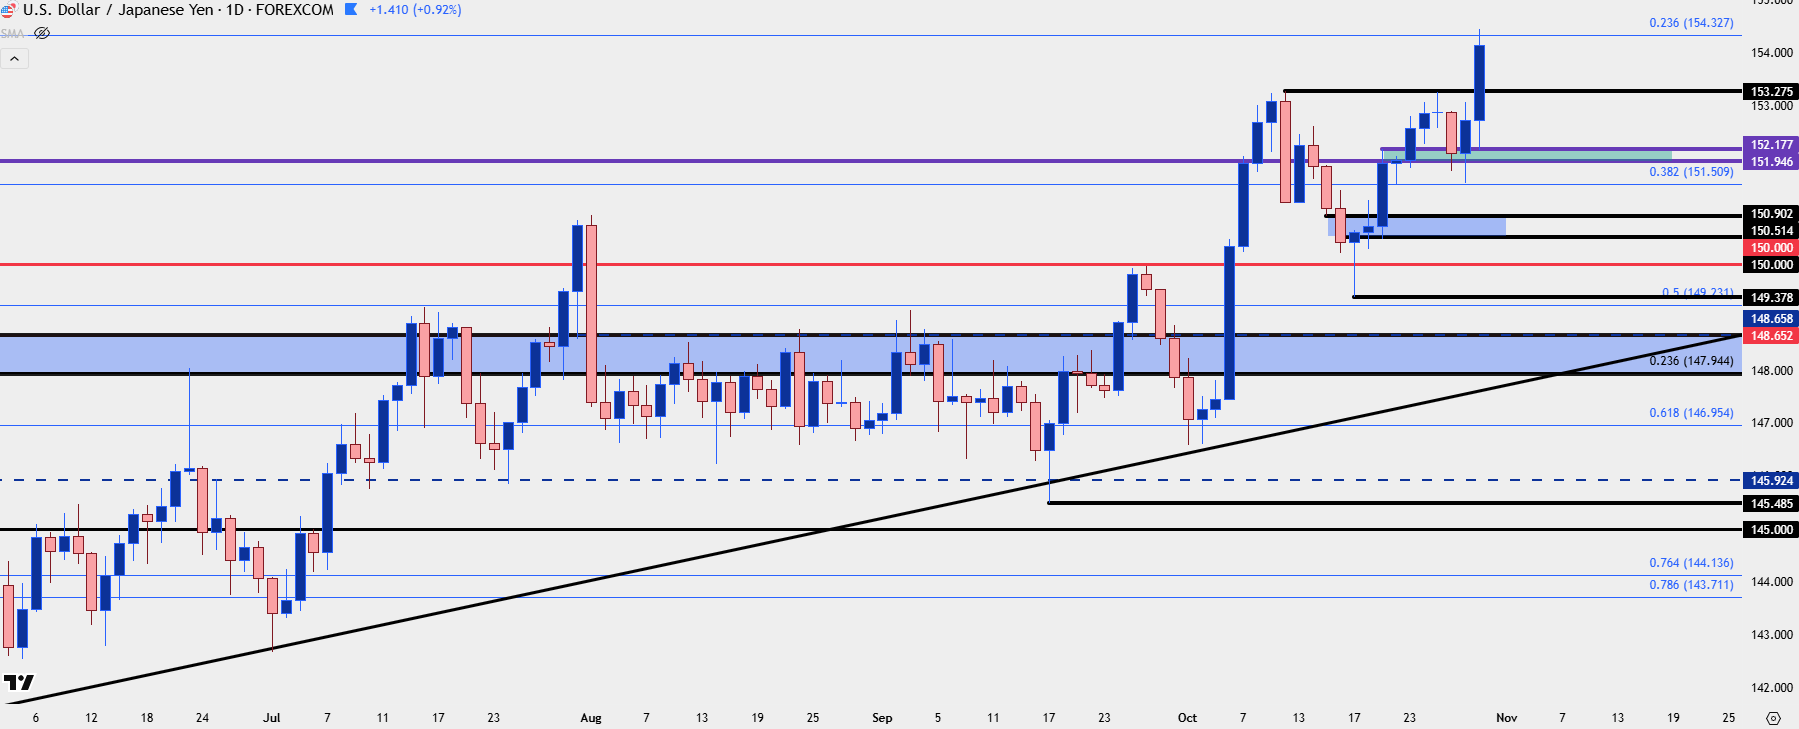
Chart prepared by James Stanley; data derived from Tradingview
USD/CAD
There was a rate cut from Canada ahead of yesterday’s FOMC move, and that’s setup up a clear v-shaped reversal in USD/CAD. And notably, this has played cleanly with the levels that I’ve been tracking, as it was the 1.3897 level that held the swing low yesterday, and the current bounce is right back up to the 1.4000 level. There’s even been a short-term pullback holding support at 1.3981 and this sets up for the possible return of bullish price action in the pair.
The 1.4000 level is now the big deal as a major psychological level of that nature will often take time to gain acceptance, but a topside test above that price opens the door for bulls to stretch up to 1.4034 and then 1.4061. If those levels trade, we’ll have continuation of the v-shaped reversal and that’s something that can be tracked for bullish trend continuation.
USD/CAD Four-Hour Price Chart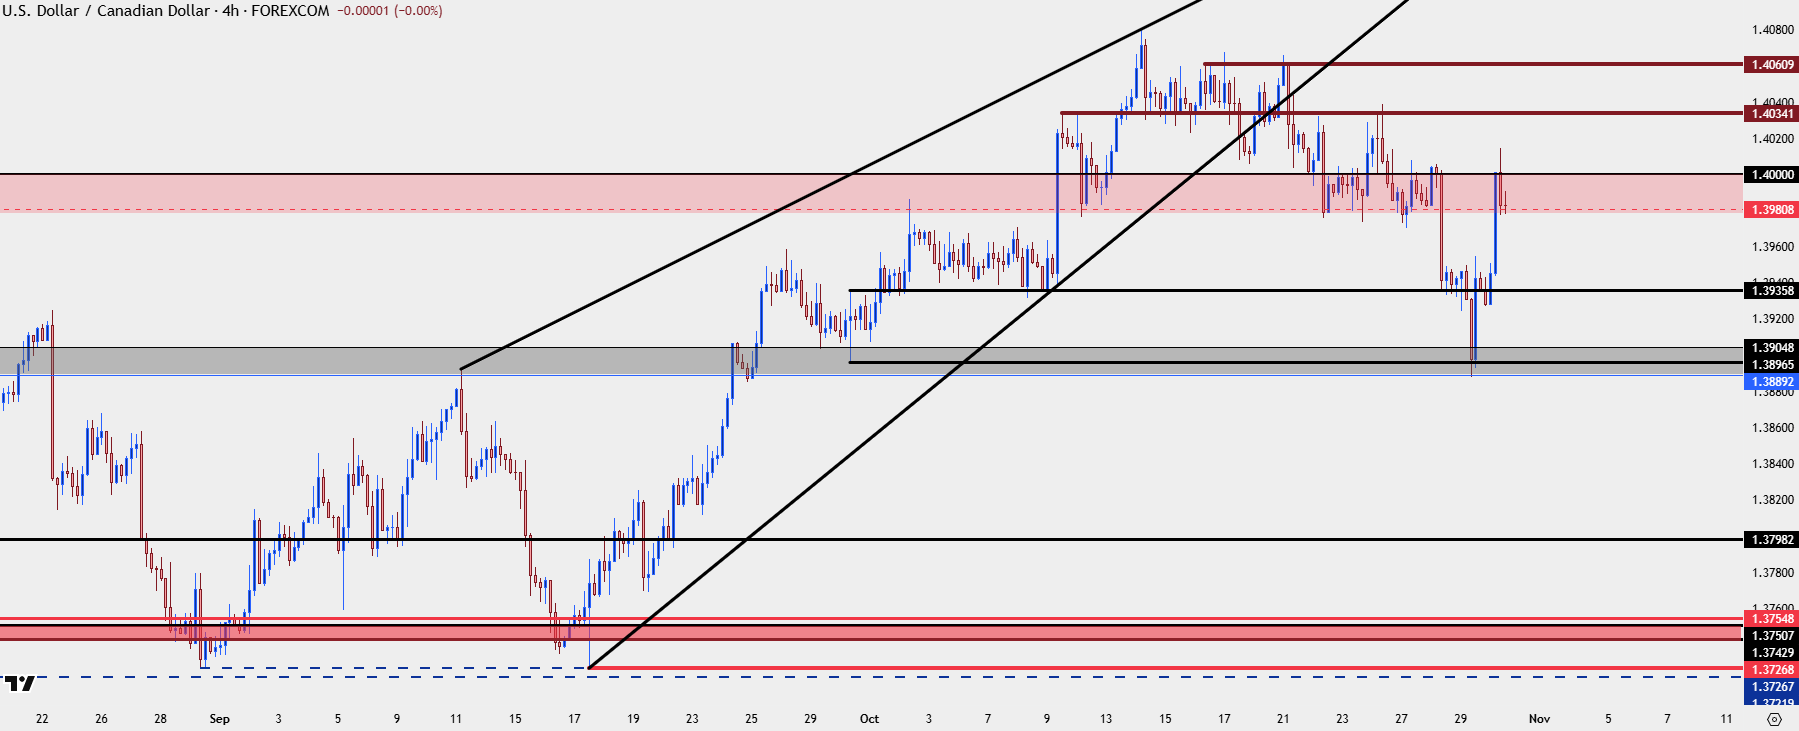
Chart prepared by James Stanley; data derived from Tradingview
--- written by James Stanley, Senior Strategist