

The aftermath of yesterday’s FOMC rate decision was a green light for Dollar bulls, as the DXY index continued a rally from support and a falling wedge formation until pushing back into the 100.22 level. But, as I wrote at the time it was USD/JPY that would likely have significant pull on whether the Dollar rally could continue, and at this point, both markets are down on net following a strong and decisive reversal.
In the DXY basket it was the 100.22 level that ultimately held the highs, and at this point, that’s a lower-high as buyers were unable to force a re-test of the swing-high from last week.
That’s now leading to a lower-low, as the 99.48 level that held support well earlier this week has been traded through. This was a setup I had looked at in the Tuesday webinar and while initially running into breakout and serving as a higher-low, the move so far today brings that bullish directional lean into question.
US Dollar Four-Hour Chart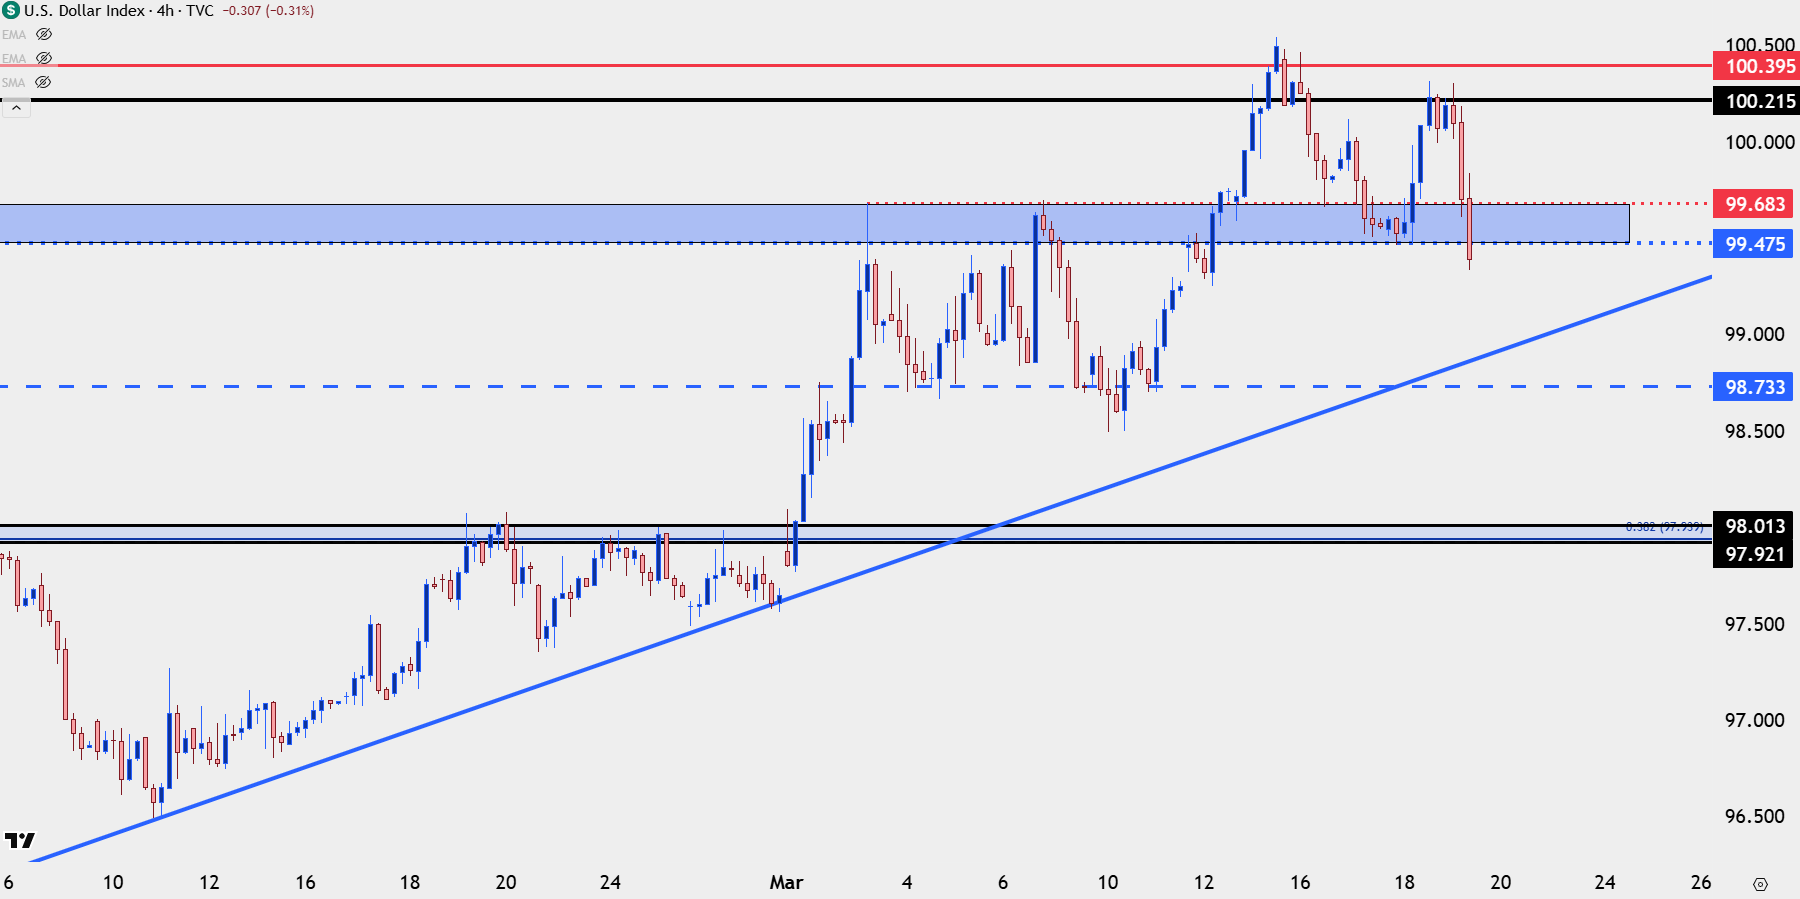
Chart prepared by James Stanley; data derived from Tradingview
From the Dollar’s daily chart, there’s still an ascending triangle formation in the equation so it’s not all doom and gloom yet, as there’s possible trendline support a little lower and then the 98.73 level that had held the prior higher-low.
But whether or not that can come to fruition will likely boil back to another factor elsewhere, and this is the same that drove the massive sell-off in DXY back in January following a Bank of Japan rate decision.
US Dollar Daily Chart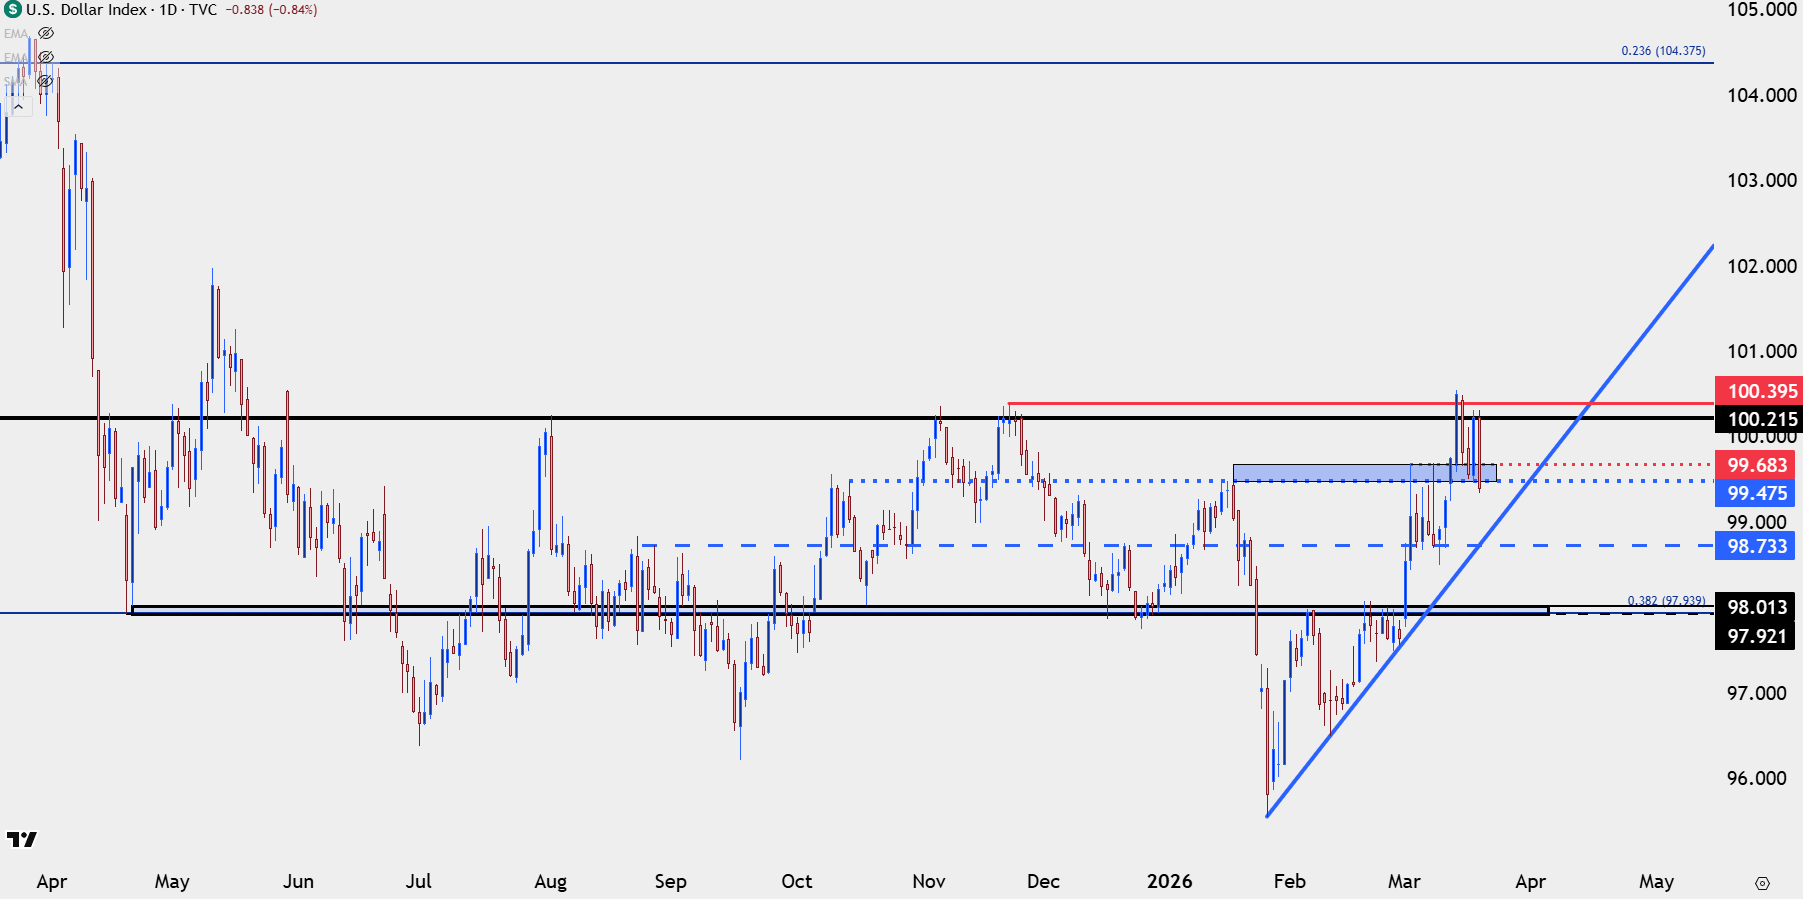
Chart prepared by James Stanley; data derived from Tradingview
USD/JPY As the Driver
The Japanese Yen is just 13.6% of the DXY basket so it may sound strange to hear that the driver for the Dollar and, in turn, major FX pairs derives from the USD/JPY pair. But one look at the five-year outlay shows how this is still a very crowded, one-sided trade on the long side of USD/JPY and if we look at the four largest components of the DXY basket, it’s the Yen-weakness that really stands out.
If the Japanese Yen wasn’t so weak, then logically speaking the USD would be weaker and this would likely be to the approval of President Trump.
The below chart is the DXY basket (as candlestick) along with those four largest components, and you’ll notice what an outlier USD/JPY has been. One way of thinking of this is that USD-strength and JPY-weakness are what’s responsible for the move and a weaker USD would make exports easier for the US, which is one of the big reasons President Trump has been championing USD weakness since his inauguration last year.
US Dollar v/s DXY Components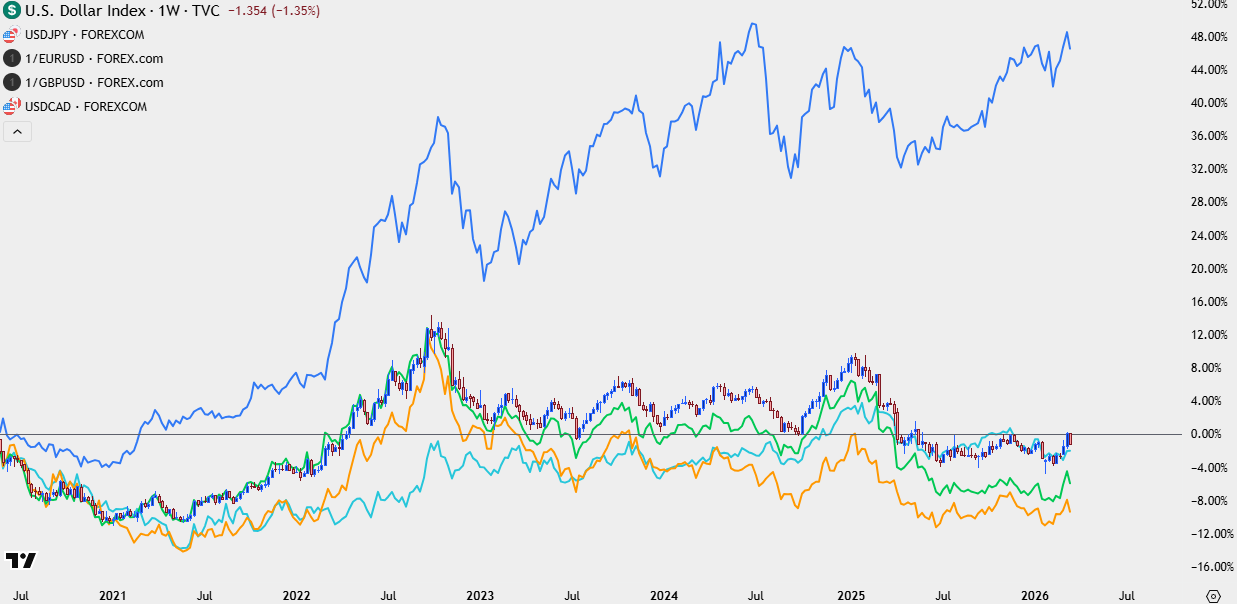
Chart prepared by James Stanley; data derived from Tradingview
USD/JPY 160.00
While these trends of USD-strength and JPY-weakness have been fairly clear for the past five-plus years, there’s been a continued case of concern around the 160.00 handle in the pair, which has delivered its share of drama over the past two years. While Japanese fiscal policy remains heavily pro-growth, the net of that has largely been JPY-weakness, such as we can see from the 150.00 break in the pair back in October after Sanae Takaichi’s election win.
But it was in late-January that the pair stumbled before testing the big figure in a move that was widely accused to have been intervention. That led to a sizable pullback in the pair and along with it, USD-weakness drove a strong breakout in EUR/USD and GBP/USD. This was evidence of what I’m referring to with the USD/JPY as the main push point for the DXY basket.
As the elevated and well-entrenched trend pulled back just a little, fueled by USD/JPY longs closing positions, USD-weakness filtered in elsewhere such as the Euro and British Pound.
So far today we’ve seen a decisive move in USD/JPY and a similar backdrop has appeared, with EUR/USD and GBP/USD strength showing up after both markets sold off yesterday.
USD/JPY Weekly Chart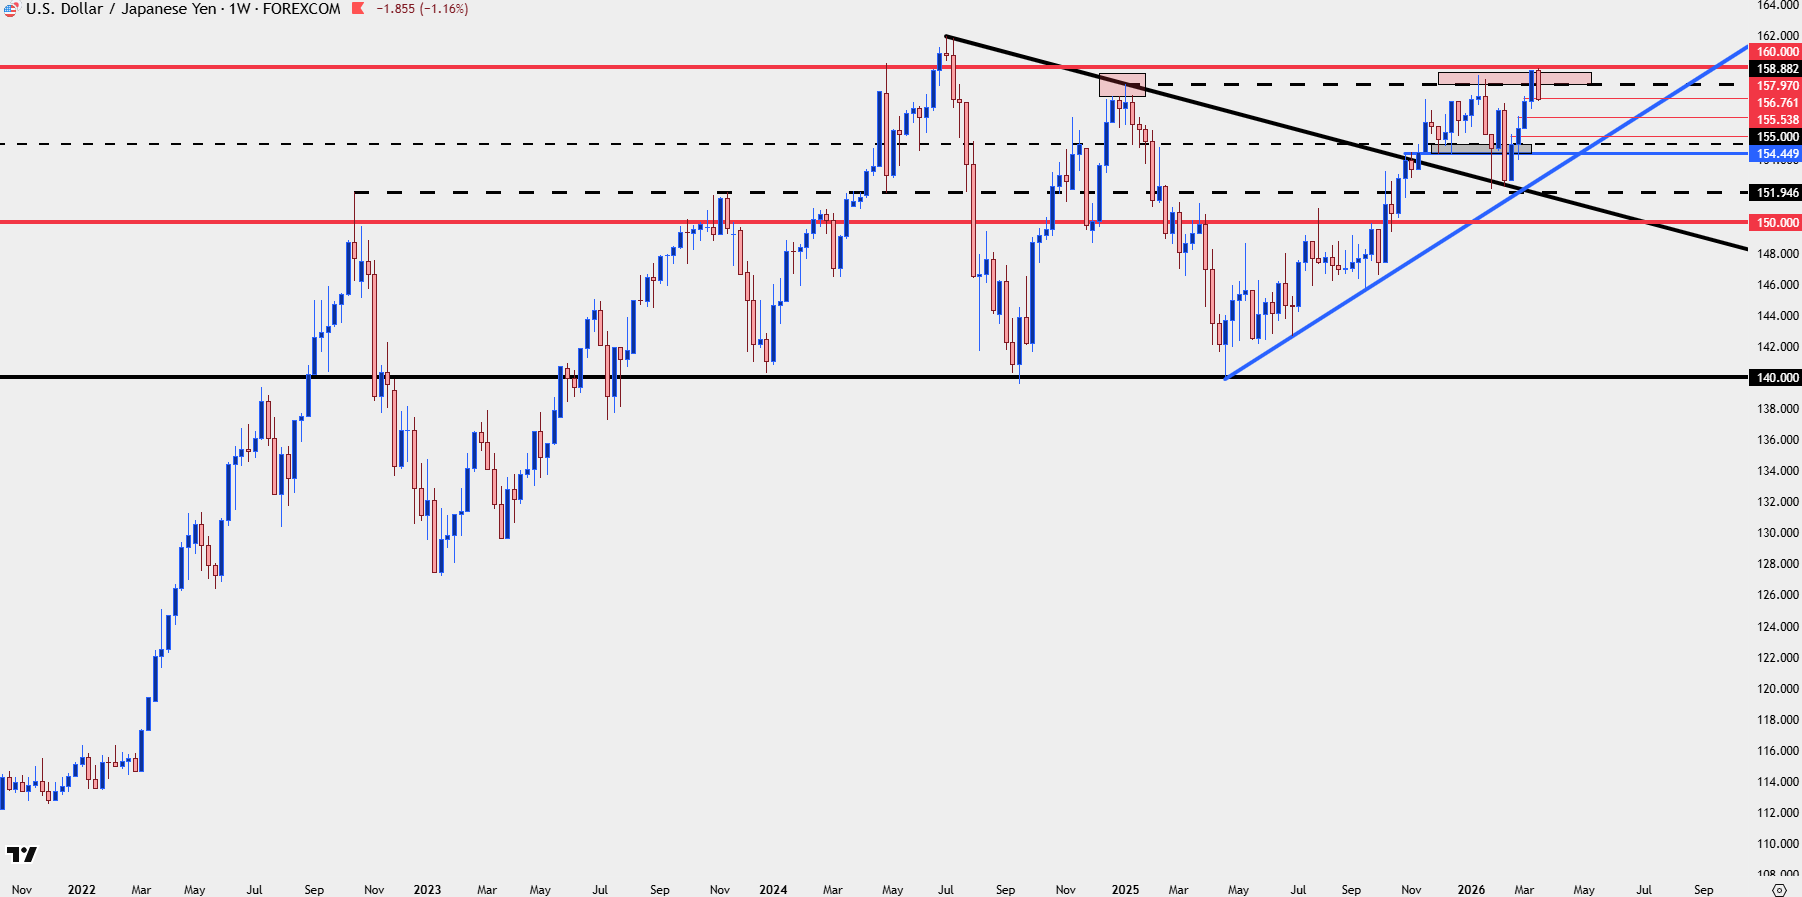
Chart prepared by James Stanley; data derived from Tradingview
USD/JPY: What’s Behind the Move
As mentioned above that late-January sell-off was widely accused to have been intervention. As I said around the time, I wasn’t so sure, as it seemed that it could have been an organic move driven by a crowded trade leading to a crowded exit. The sell-off in early-February, however, takes on more indication of potential intervention, in my opinion, driven by the fact that the pair sold off on items that were seemingly positive. The Sanae Takaichi snap election win is something widely considered to have been bullish. And after an initial rally after the open, the pair was hit hard. Later that week, a strong NFP report out of the US was similarly bullish for the pair and after an initial reaction of strength, sellers pushed back to the same 152.50 level that was in play a couple of weeks prior.
Given how the BoJ ambushed markets in July of 2024 with an intervention on the morning of a US CPI print, it made sense that perhaps they were looking to get the most bang for the buck while pushing the pair down from another rally.
But the thing about interventions is that we can’t confirm them until well after the fact, at the point where it doesn’t even matter any longer because the move has already been baked in.
As of right now USD/JPY is re-testing support at prior resistance. And while the run has been decisive on the daily, the fundamental divergence in the pair remains, so there could be a case for longs if (and this is a big if) support begins to play out.
If it doesn’t – we could be on the verge of a strong sell-off into the end of the week and that would likely come along with those accusations of intervention. The next support level down is 156.39, after which the 154.45-155.00 zone comes into play.
USD/JPY Daily Chart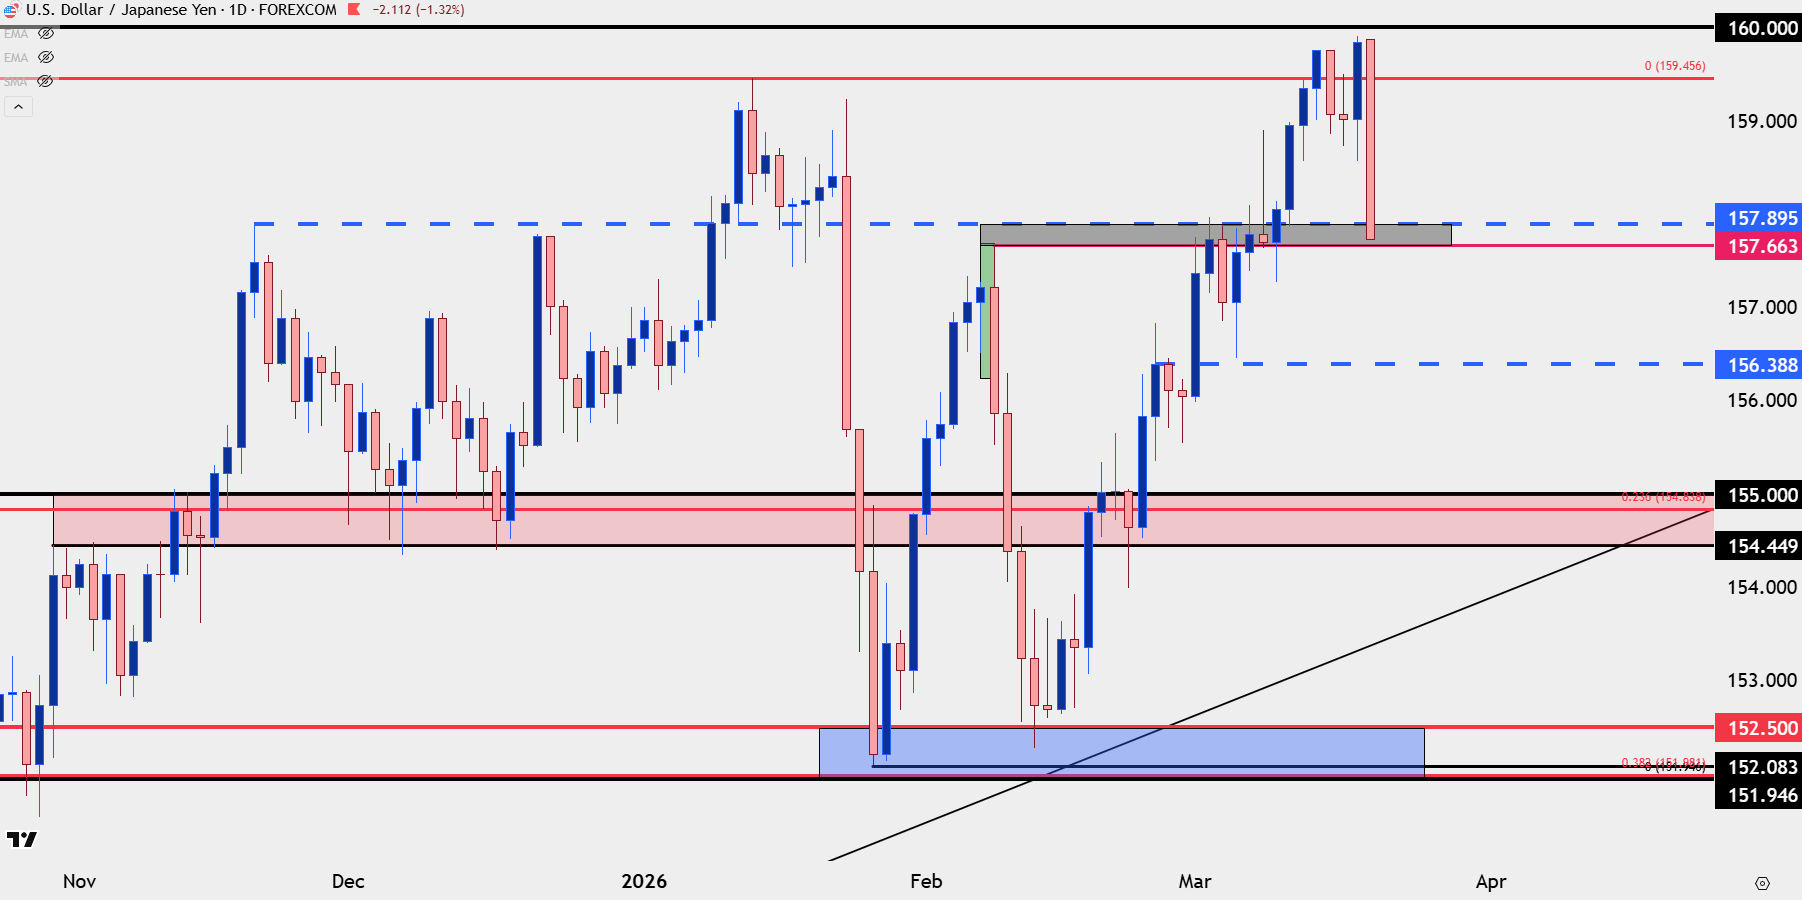
Chart prepared by James Stanley; data derived from Tradingview
--- written by James Stanley, Senior Market Analyst, Global Macro