
While inflation printed a touch below expectations this morning with Core at 2.6% v/s a 2.7% expectation, the US Dollar remains up on the session as the currency erased early-week losses. Of course, the news over the weekend was of surprise as it was announced that the Department of Justice was launching a criminal inquiry into the summer testimony of Jerome Powell pertaining to the bank’s renovations, and that was squarely addressed by Powell in a video distributed on Sunday night where Powell alleged Trump of attacking the bank’s independence.
Since then, the White House has come out to say that they weren’t behind it and from a perspective of logic, it makes little sense that Trump would move to ouster Powell with only four months until he can replace him as the Chairman of the FOMC. I talked about that in the EUR/USD article yesterday and a day later I still believe that to be the case; and in the backdrop of the US Dollar, the currency retains a bullish short-term bias as much of the prior sell-off has been recovered.
From the daily chart, the next spot of resistance is already nearby at 99.31, and bigger picture, it’s the 100.22 level that rebuked bulls multiple times in the second-half of last year; and that’s the spot that buyers need to beat to exhibit control of the currency.
US Dollar Daily Chart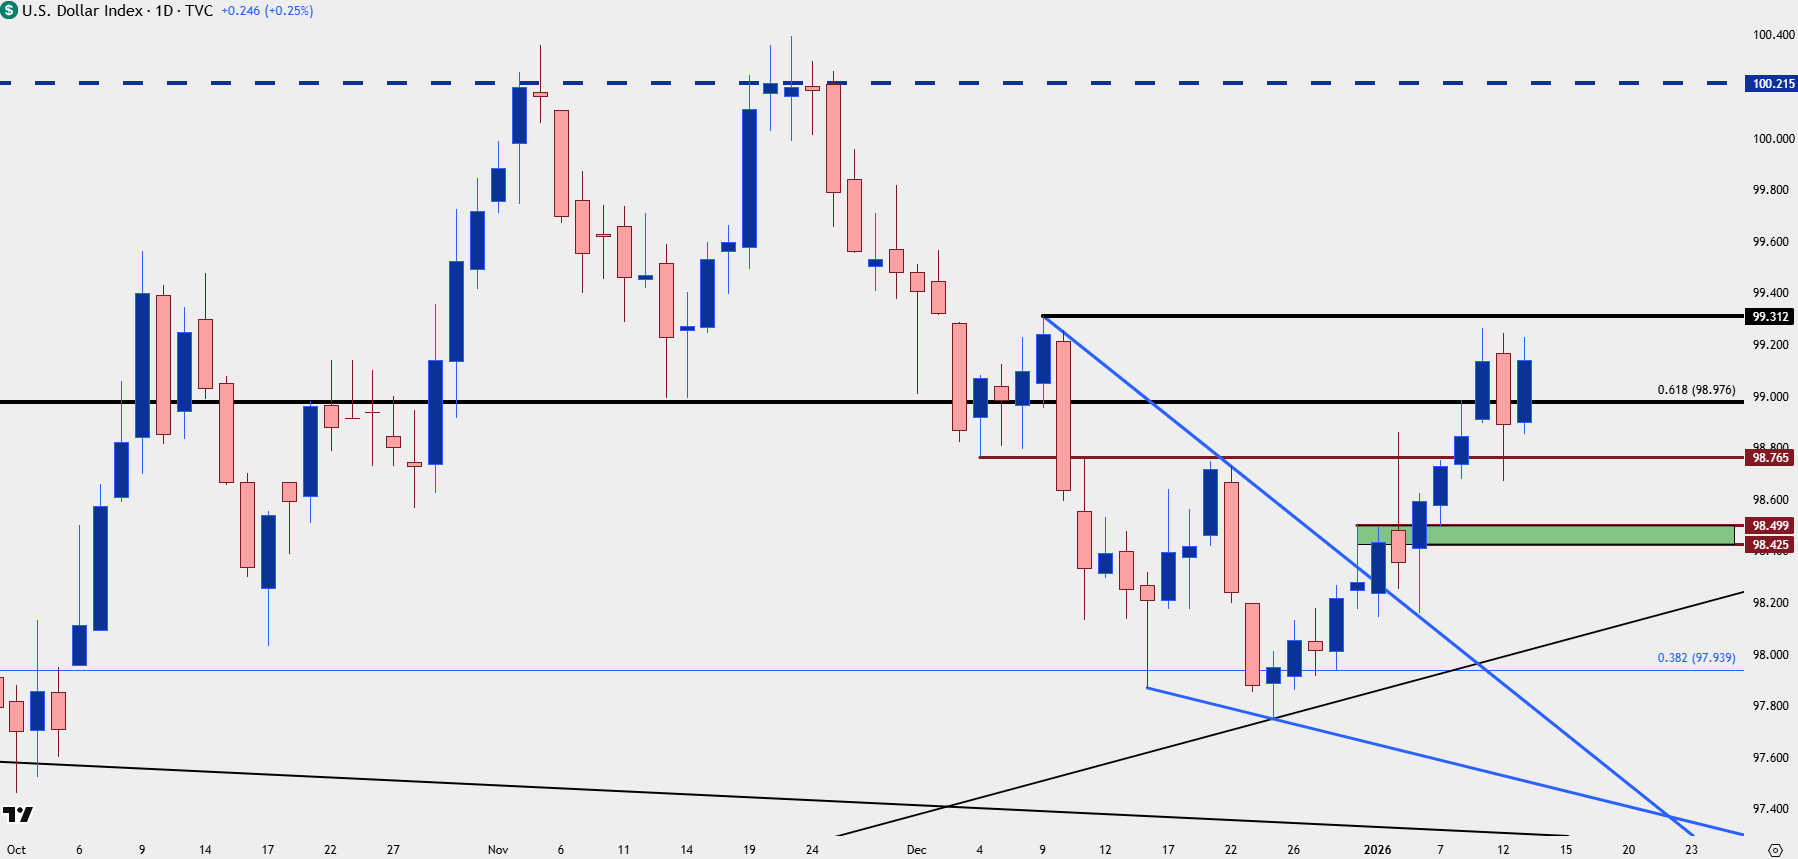
Chart prepared by James Stanley; data derived from Tradingview
USD Weekly
It’s the longer-term chart that remains of interest here as this helps to put into scope how the USD sell-off last year was largely concentrated in the first-half of 2025, and how more recently, it’s been buyers staging a defense of higher-low support that’s dominated action in the DXY. And now the weekly bar is illustrating a wide underside wick as buyers are going back for the near-term highs, which highlights bullish breakout potential.
Whether that comes to pass probably has something to do with the Euro, looked at below.
US Dollar Weekly Chart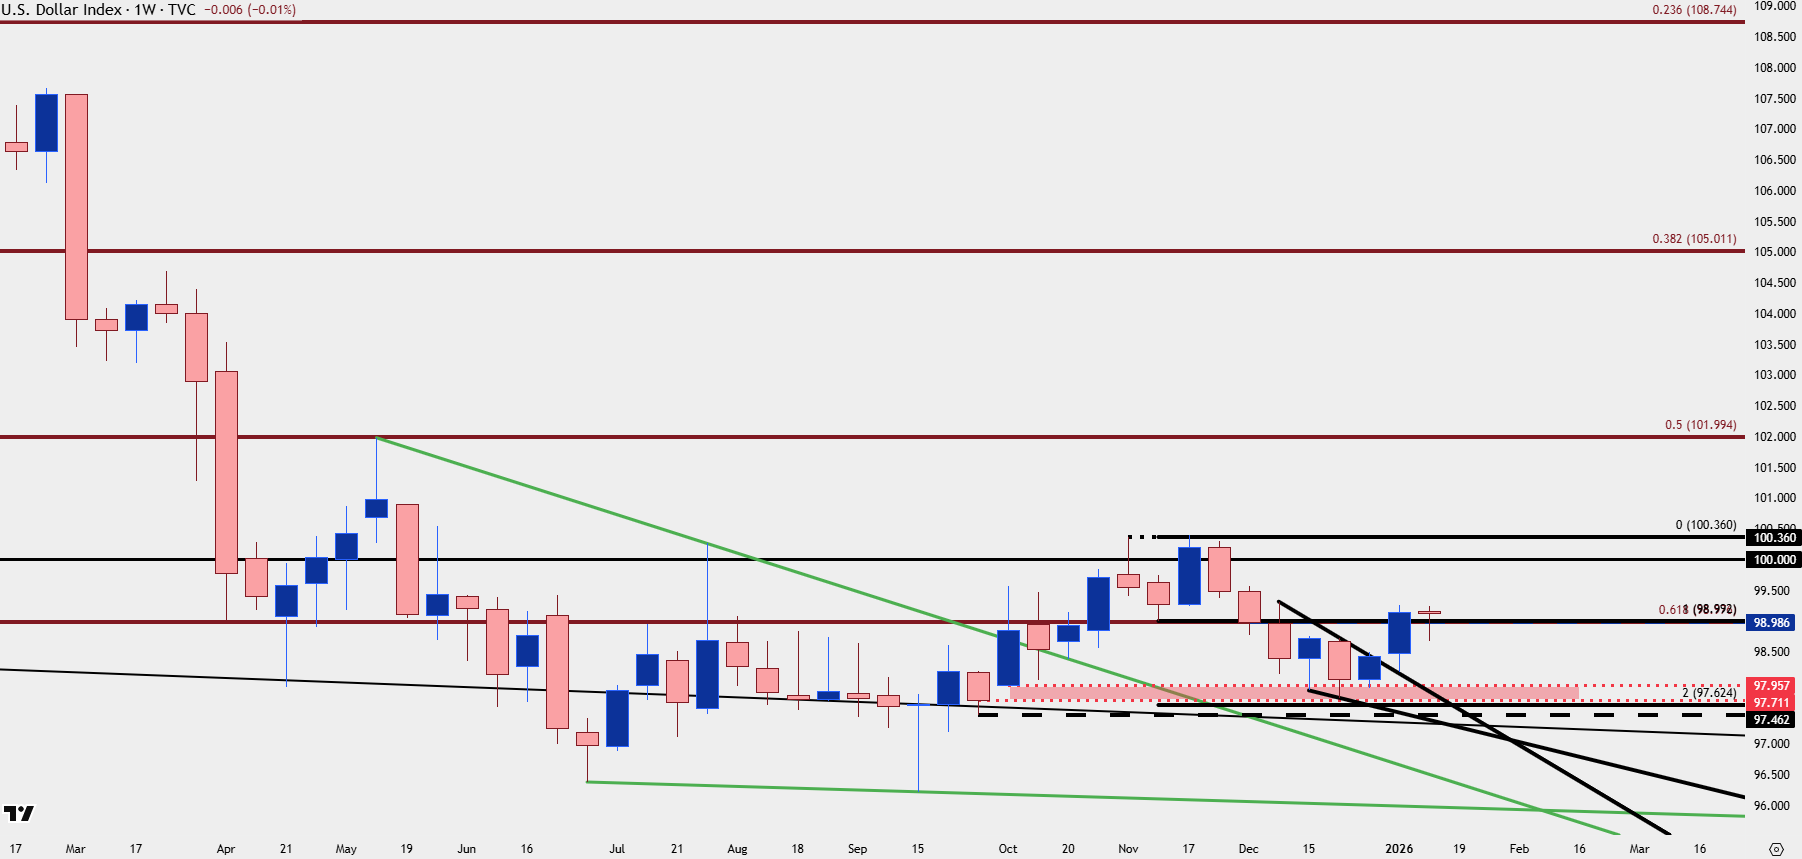
Chart prepared by James Stanley; data derived from Tradingview
EUR/USD
I’ve been saying for some time now that I think the key for FX trends rests with the Euro, as this is 57.6% of the USD basket and that’s been one of the dominating factors over the past six months as both USD and EUR/USD have stalled at major inflection areas on the chart.

In EUR/USD, the pair largely adhered to structure last week with a push down towards and a defense of 1.1616, which led to a bounce. And that bounce in the early part of this week has so far been faded as sellers defended both 1.1686 and 1.1669. For next support, I’m tracking 1.1593-1.1600, and then 1.1542-1.1550 and then the ‘big’ zone is the 1.1500 level that was support back in November.
EUR/USD Daily Price Chart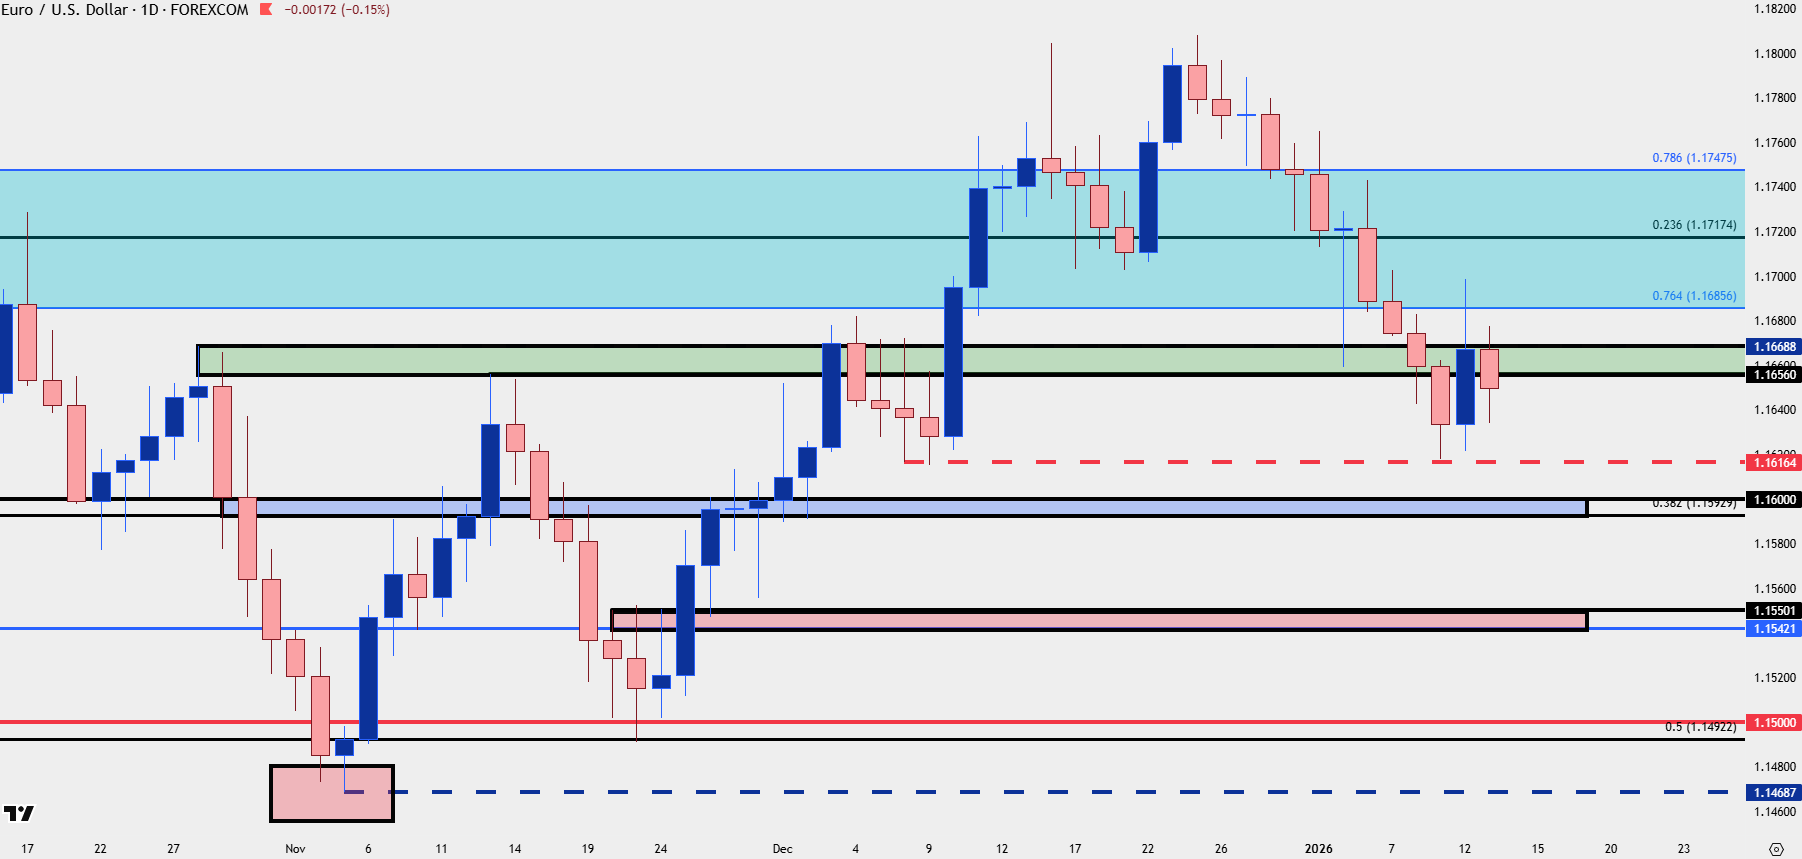
Chart prepared by James Stanley; data derived from Tradingview
GBP/USD
For USD-weakness I’m continuing to track GBP/USD and the pair is near a key zone of support. Both Friday and Monday saw support at the Fibonacci level of 1.3390, and this opens the door for a possible higher-low at 1.3414 to keep the door open for bullish continuation.
GBP/USD Daily Price Chart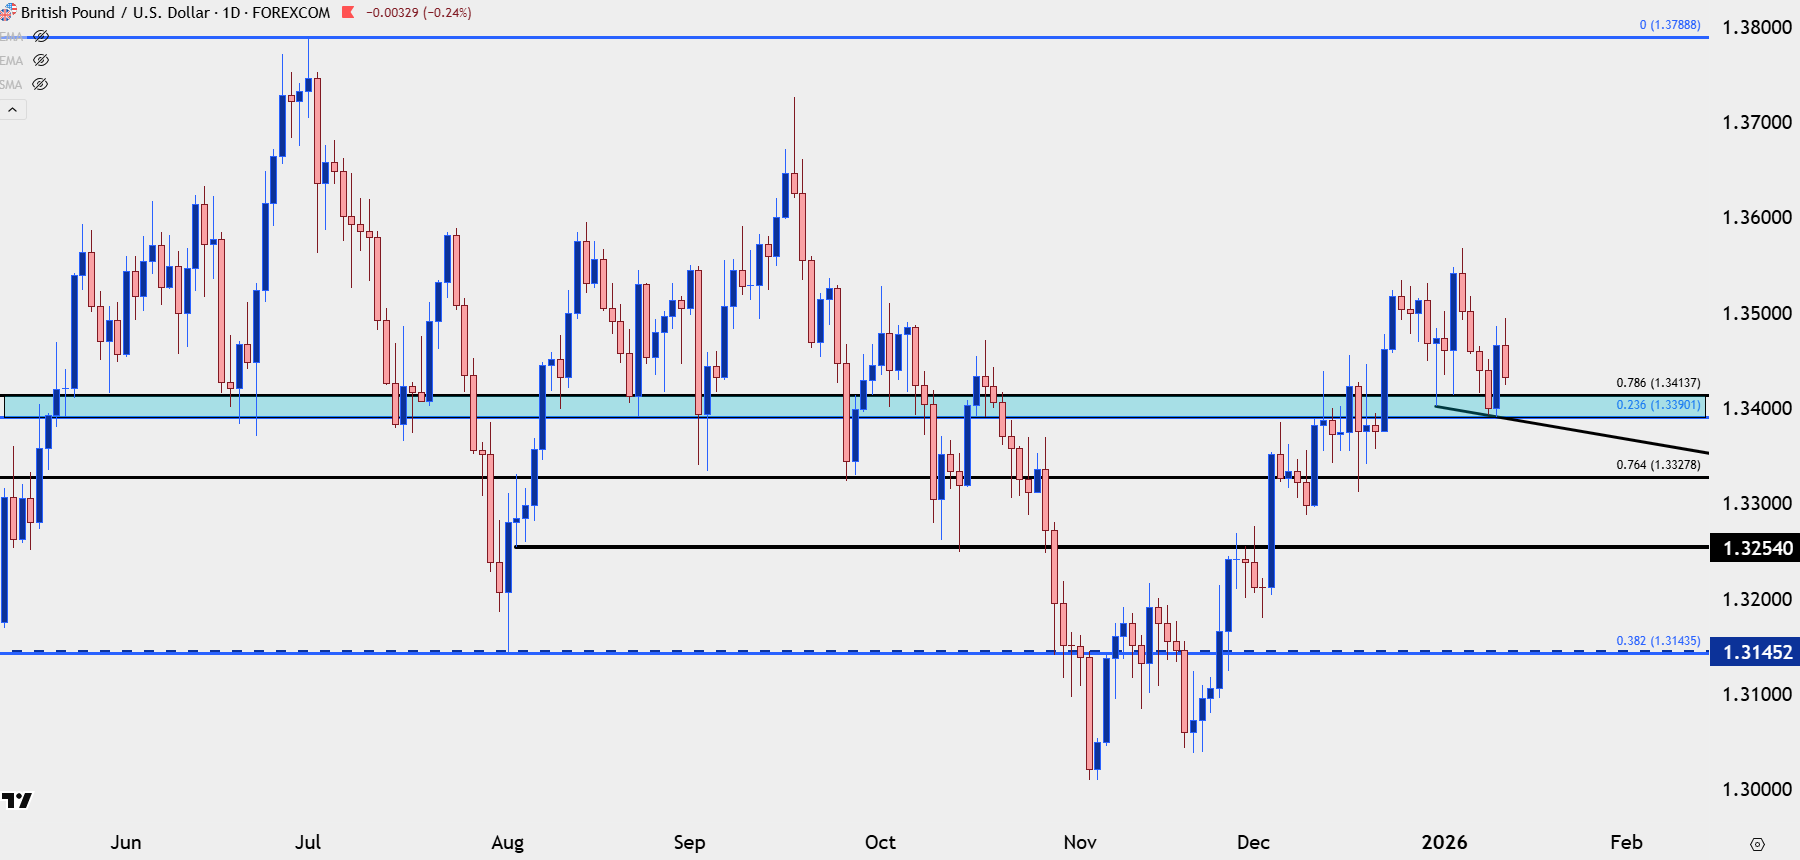
Chart prepared by James Stanley; data derived from Tradingview

USD/JPY
For USD-strength I’m still following USD/JPY, which has pushed up to a fresh yearly high today. As we get closer to 160.00 the prospect of continuation becomes a more daunting topic, but that’s still no reason to look for reversals yet. Instead, prior resistance becomes attractive for higher-low support structure, and the horizontal resistance from the ascending triangle that led into the current breakout remains a point of reference for that at 159.19.
USD/JPY Four-Hour Chart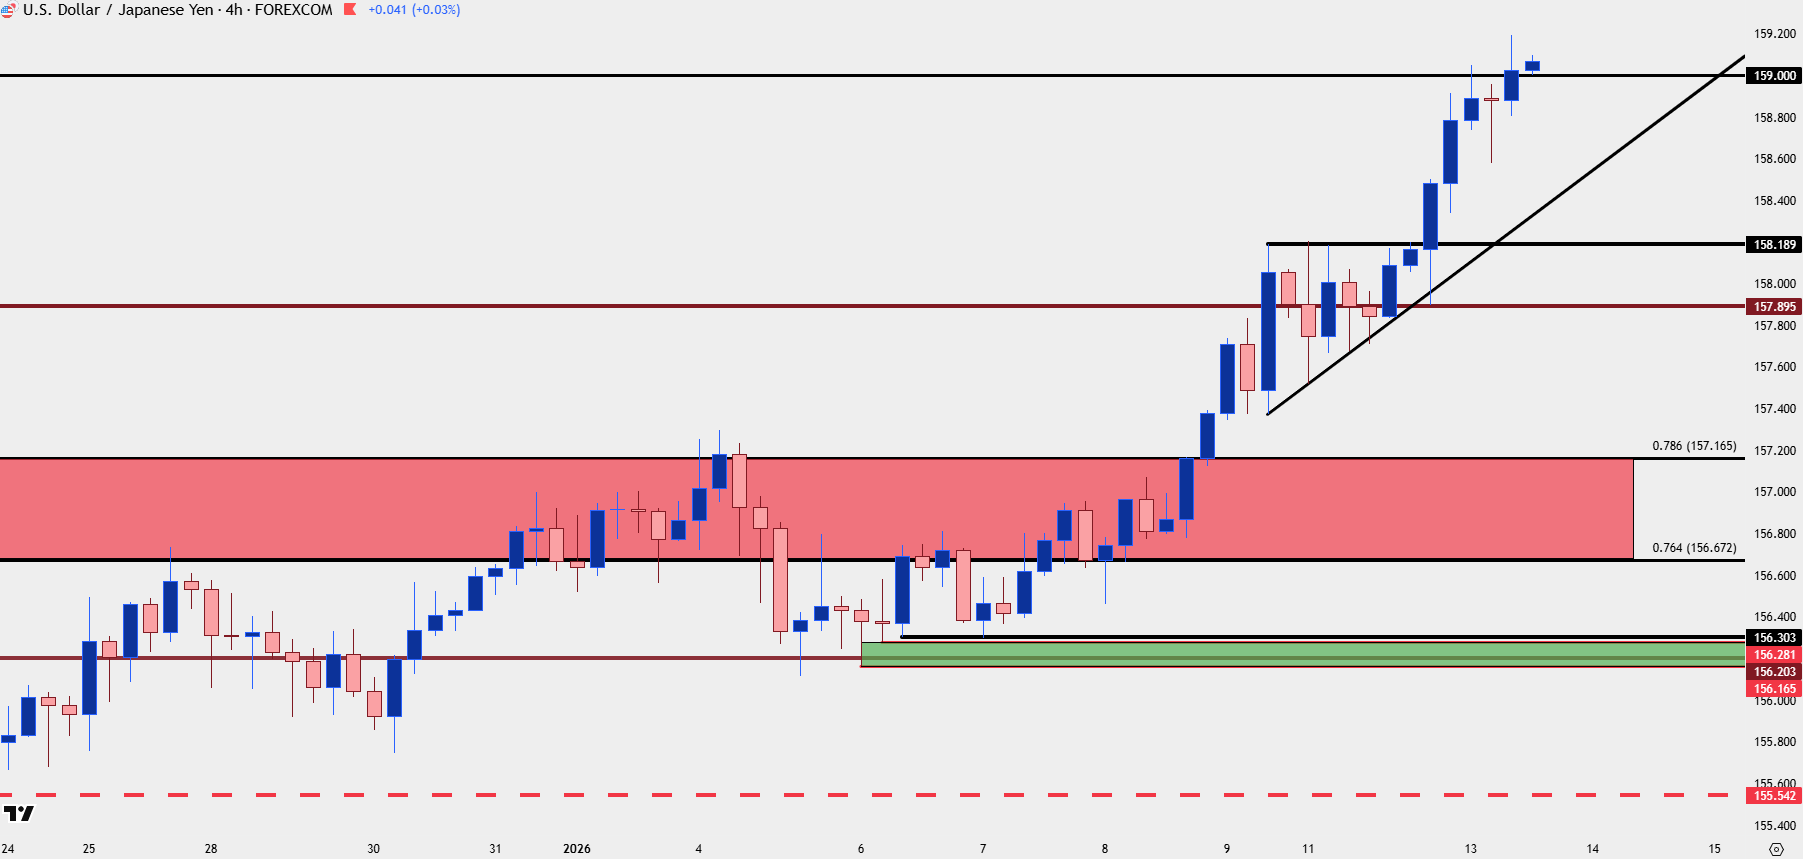
Chart prepared by James Stanley; data derived from Tradingview
Gold
Gold is my top trade idea for 2026 and it just set yet another fresh ATH earlier today. At this point it doesn’t appear as though spot Gold has acceptance over the $4600/oz level, so I’d look to pullbacks and support tests at either s1 of 4575, s2 or 4550 or s3 of 4500, which was clean resistance and hasn’t yet shown as support.
Gold Four-Hour Chart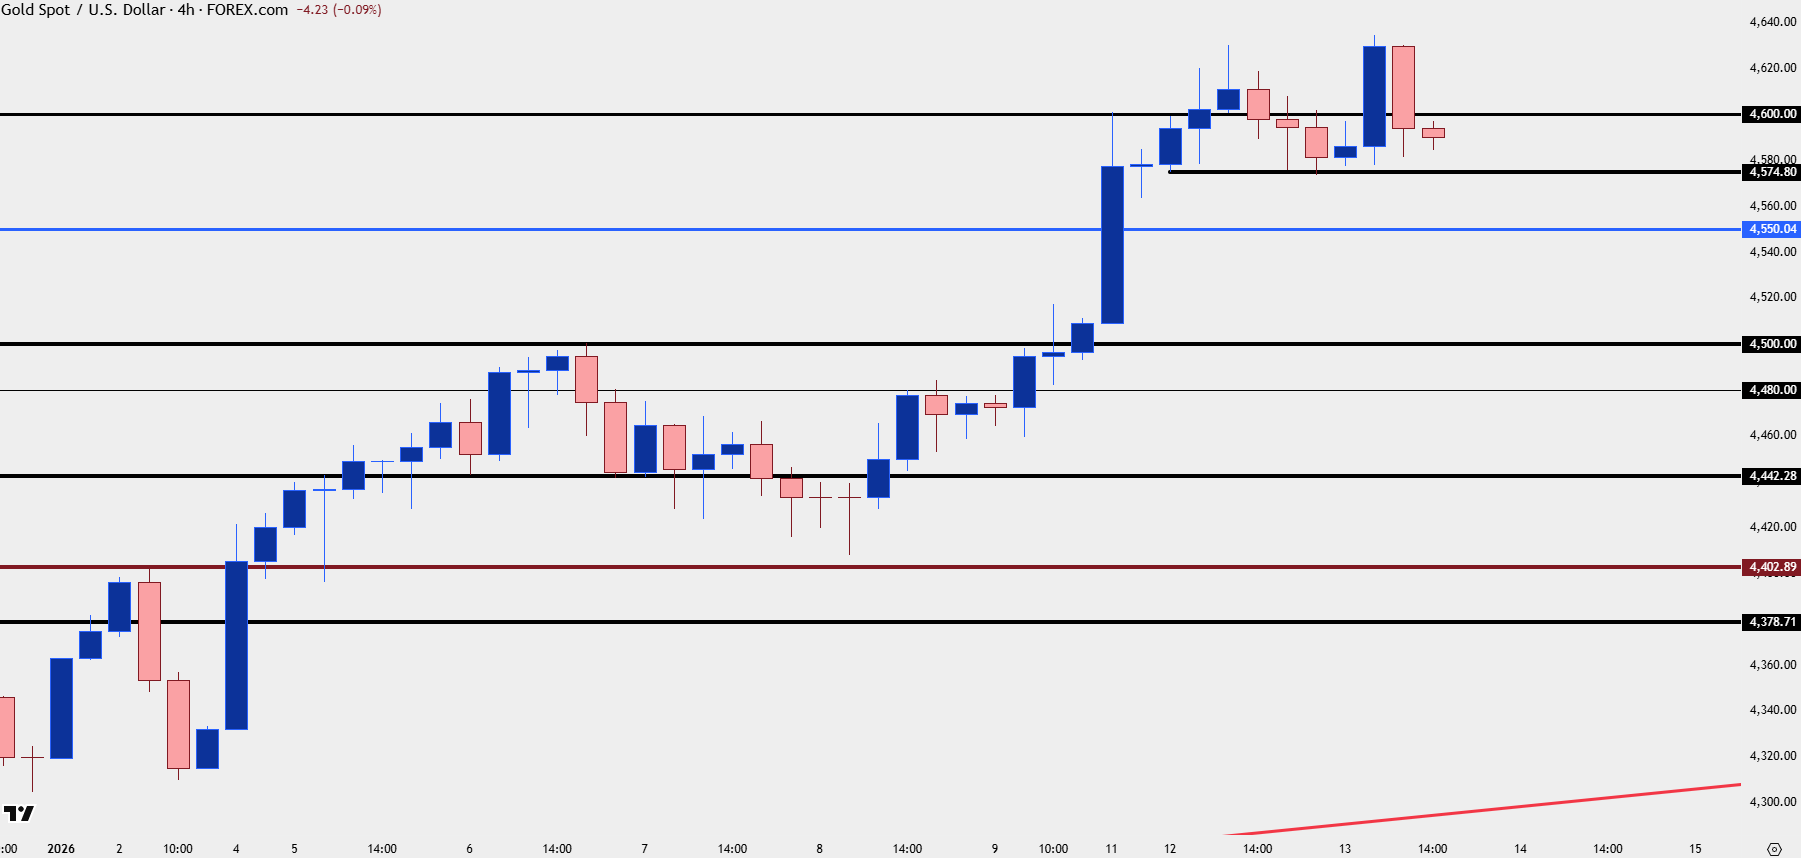
Chart prepared by James Stanley; data derived from Tradingview
Bitcoin
Late last year I started to look for enthusiasm in gold to spread into other anti-fiat markets, with Bitcoin being the primary focal point. After all, this is what happened in August of 2020 and then again when Gold built bull pennants in 2024 and 2025. But, this time, Silver took over in a very big way and that move remains parabolic at this point.
Bitcoin, however, struggled a bit into the end of 2025 and it’s started to come to life in early 2026 trade. At this point, I have BTC in an ascending triangle formation with fairly rigid resistance around the 95k level. We’re already near that resistance zone so it’s a difficult move to chase at this point, but there is some internal support structure that I’ll look at below.
BTC/USD Daily Price Chart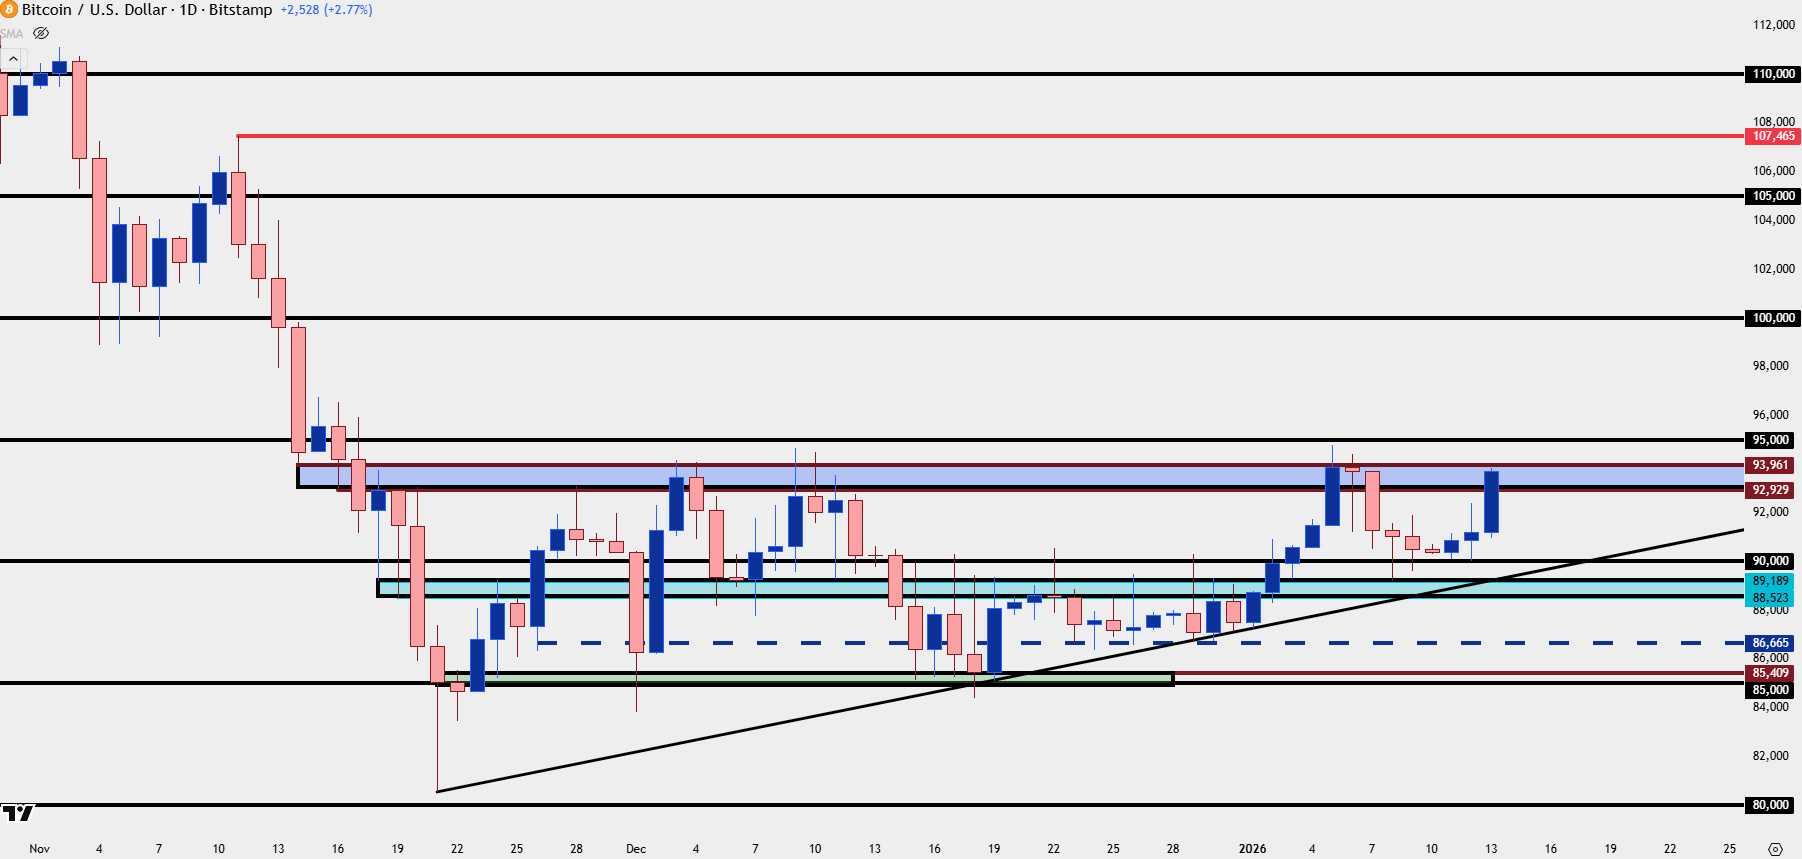
Chart prepared by James Stanley; data derived from Tradingview
BTC/USD Shorter-Term
From the four-hour chart there’s a couple of spots of prior resistance that could function as higher-low support, with 91,924 standing out, followed by 90,925. The 90k level would be the price that bulls must defend to retain control or else it’s going to take on the look of a failed breakout.
BTC/USD Four-Hour Chart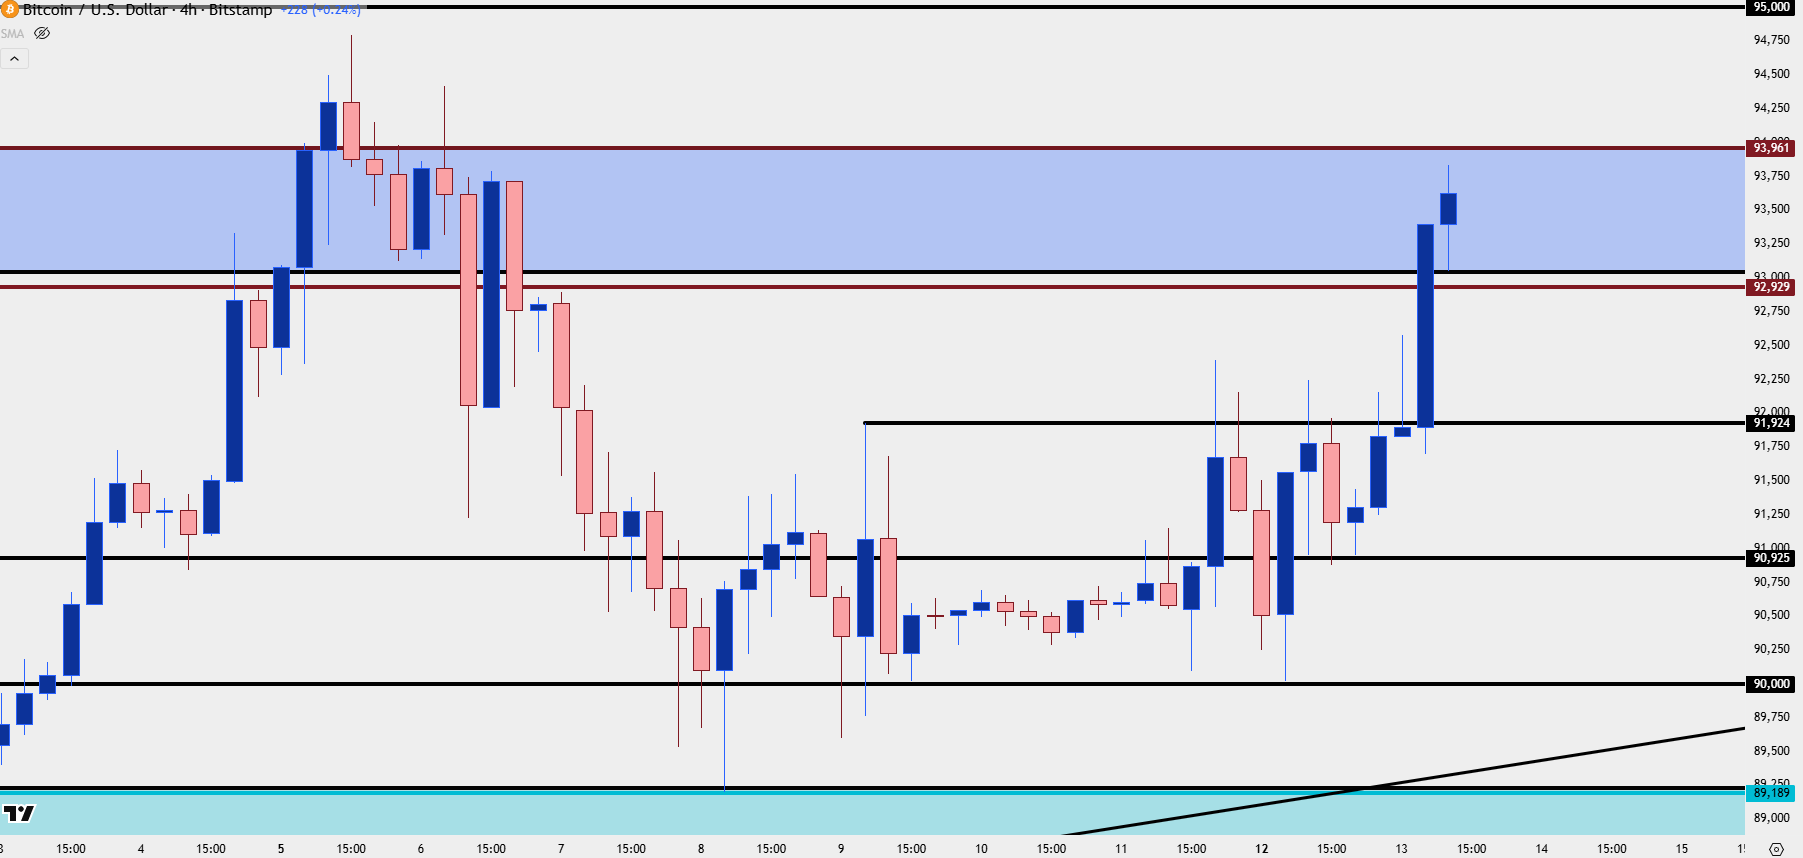
Chart prepared by James Stanley; data derived from Tradingview
--- written by James Stanley, Senior Market Analyst, Global Macro