


The third week of December comes to an end, and with it, the cryptocurrency market has begun to show a renewed sense of sustained bearish pressure across recent price movements. Despite attempts by major cryptocurrencies to post short-term rebounds, the bearish bias continues to dominate, suggesting that weak demand for crypto assets has become a persistent feature as 2025 approaches its close. Since the beginning of December, selling pressure has gained prominence, indicating that a continued lack of confidence may be influencing the behavior of leading cryptocurrencies, a dynamic that could remain in place over the coming trading sessions.

Performance of Major Cryptocurrencies
Source: Data - StoneX, Tradingview
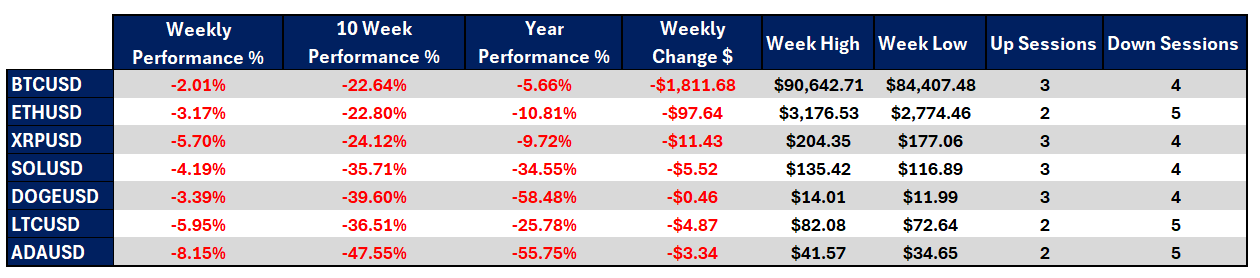
- In the balance of the past trading week, all major cryptocurrencies posted consistent losses. Bitcoin was the asset that best managed to contain downside pressure, with a moderate decline of -2.01%, while Cardano was the most affected cryptocurrency by the end of the week, registering a loss of -8.15%.
- Looking at performance over the past ten weeks, bullish attempts have proven insufficient to sustain clear upward trends, allowing bearish momentum to continue dominating the medium-term outlook. All major cryptocurrencies remain firmly in negative territory, with Cardano once again standing out, posting an accumulated decline of -47.55%. Although it has shown a modest recovery compared to last week’s data, it still reflects a significant loss. Bitcoin, meanwhile, has been more resilient, with an accumulated decline of -22.64%, positioning it as the asset that has best withstood selling pressure during this period, although it still maintains a dominant bearish bias.
- So far this year, all cryptocurrencies are heading toward a negative close in 2025. Bitcoin has been the least affected, with an accumulated decline of -5.66%, while Dogecoin remains the most heavily impacted, with an annual drop of -58.48%, positioning it as the worst-performing asset of the year and likely on track to close 2025 with the poorest performance.
- Bitcoin, as the benchmark asset, remains within a bearish scenario, as the weekly high only managed to reach slightly above the 90,000-dollar area, while weekly lows continue to reach levels below 85,000 dollars. This price behavior reinforces a persistent environment of weakness for BTC.
- Overall, the weekly balance confirms a predominantly bearish short-term trend and revives concerns about the cryptocurrency market’s ability to stage a sustained rebound during the final weeks of 2025.
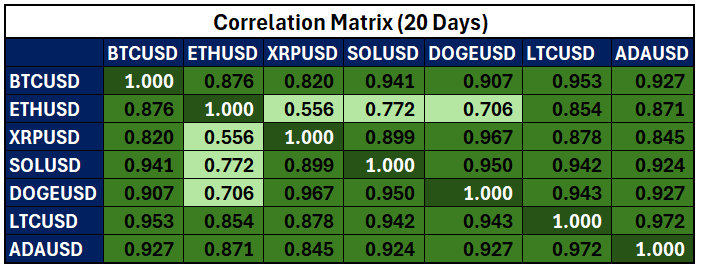
Red to green colors – red for negative correlations and green for positive correlations
Source: Data - StoneX, Tradingview
As selling pressure in the crypto market has intensified, short-term correlations between major cryptocurrencies and Bitcoin have also strengthened. At present, all major cryptocurrencies show a correlation coefficient above 0.8 relative to Bitcoin, indicating a strong positive correlation. This suggests that the generalized selling sentiment observed in recent sessions has affected the entire market, rather than isolated cryptocurrencies. It is important to note that correlation coefficients can change over time.
In this context, the persistence of a bearish bias suggests that overall market weakness has translated into a widespread lack of confidence. As long as this perception remains in place and correlations stay elevated during downside moves, selling pressure is likely to continue dominating major crypto market fluctuations toward year-end.
Bitcoin Fails to Break Out of the Bearish Trend
Source: StoneX, Tradingview
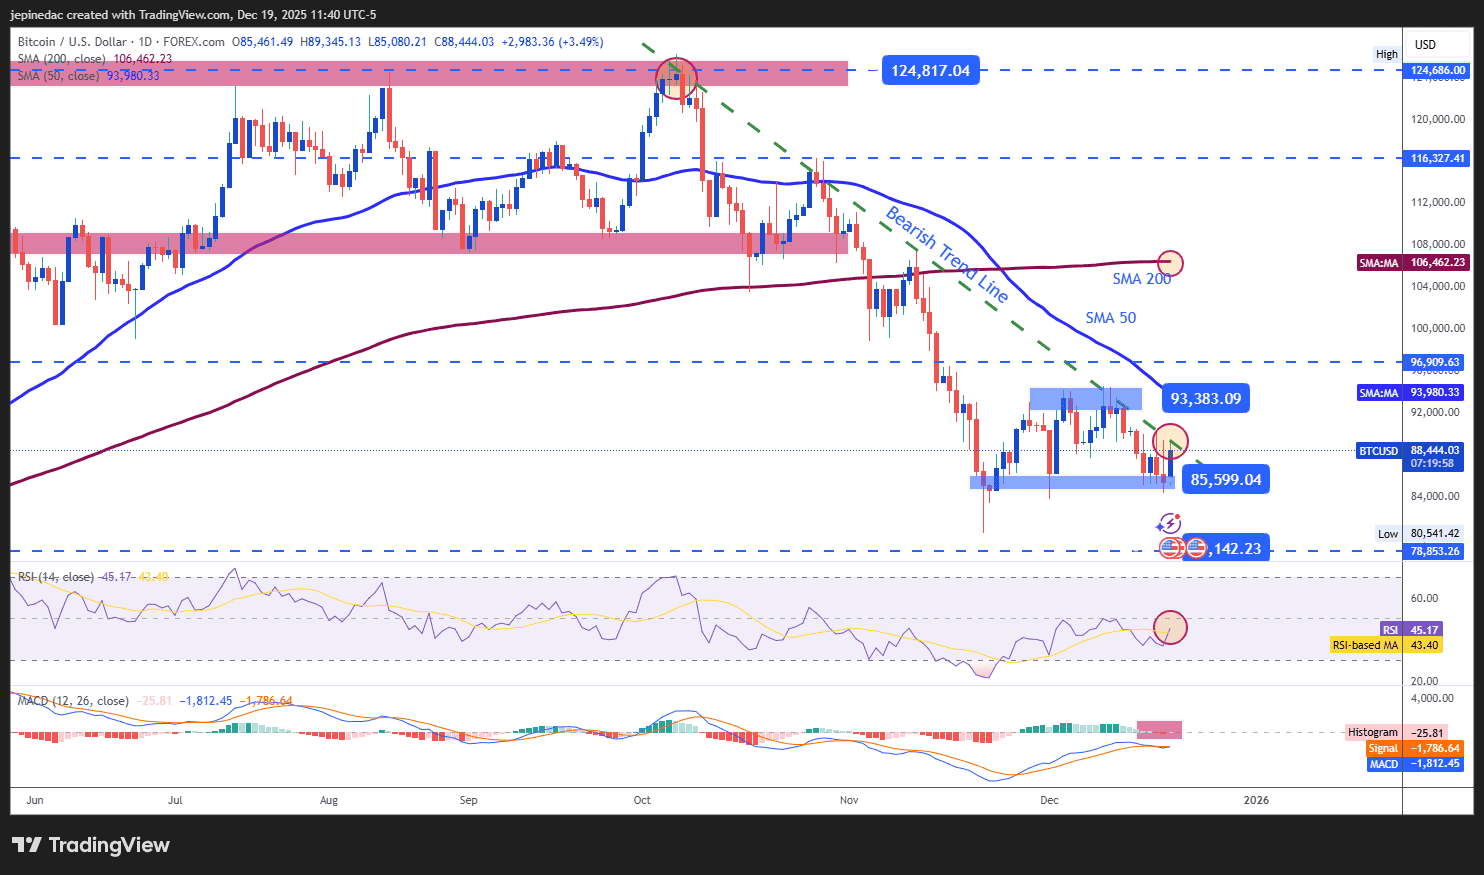
Although Bitcoin has been one of the cryptocurrencies that has best resisted selling pressure during the week, the recent price recovery has not been sufficient to overcome the long-standing bearish trendline that has remained in place since all-time highs. Despite repeated recovery attempts, BTC failed to close the week with a clear bullish bias, and the bearish trendline remains the most relevant technical reference. As long as price fails to break above key resistance zones, this structure may continue to dominate price action in the coming sessions, keeping the chart firmly within a bearish environment.
Indicators:
- The RSI is attempting to sustain a gradual recovery, with oscillations moving closer to the neutral level, although selling momentum remains dominant over the past 14 trading sessions. Meanwhile, the MACD continues to show a histogram hovering near the zero line, reflecting a technically neutral environment. Taken together, both indicators suggest that the market still lacks the momentum needed to support a meaningful short-term recovery in BTC prices.
Key Levels:
- 93,300 USD – Key resistance: A neutral level aligned with recent highs and the 50-period simple moving average. A sustained move above this zone could challenge the current bearish trendline and open the door to a more meaningful bullish bias.
- 85,600 USD – Nearby barrier: This level aligns with recent lows and represents a key neutral zone. Prolonged price action around this area could favor the formation of a short-term consolidation range.
- 79,000 USD – Major support: This level marks the yearly lows. A break below it could trigger a more aggressive selling phase and extend the dominant bearish trend.
Cardano Continues to Print New Yearly Lows

Source: StoneX, Tradingview
Cardano has consolidated its position as the worst-performing cryptocurrency of the week, with recent bearish moves leading to the formation of new 2025 lows. This reflects strong short-term selling pressure and the consolidation of an aggressive bearish trendline. However, prolonged declines may eventually lead to selling exhaustion, potentially opening the door to corrective rebounds in the coming sessions.
Indicators:
- Both the RSI and MACD remain below their neutral levels, confirming that average momentum continues to favor sellers. However, RSI has begun to show the formation of higher lows, while price continues to post lower lows, a pattern that could signal a potential bullish divergence and suggest a possible exhaustion of selling pressure in the short term.
Key Levels:
- 46.75 – Key resistance: Area of recent highs aligned with the 50-period moving average. A move above this level could weaken the dominant bearish trendline.
- 41.563 – Nearby barrier: The closest neutral price level, relevant in the event of short-term corrective attempts.
- 30.479 – Major support: A level not seen since 2024. A break below it could extend the bearish trend and reinforce selling dominance in the coming sessions.
Written by Julián Pineda, CFA, CMT – Market Analyst
Follow him on: @julianpineda25






