






And Now Back to Our Regularly Scheduled Programming
Entering this past week, there were three very large elephants in the room.
Share this:

Entering this past week, there were three very large elephants in the room that needed to be addressed:
1) Would the USMCA deal be reached?
2) What will be results of the UK elections?
3) Will the US and China sign a Phase One deal before tariffs go into effect on December 15th?
We now have the answers to 2 ½ of those questions, and perhaps the markets will start paying attention to the fundamentals and technicals again, rather than the drama. A USMCA deal was reached, Boris Johnson won the UK elections in a landslide victory, and the US and China “agreed in the text” to a trade deal which will result in the cancellation of the pending tariffs on December 15th. Although there is still some drama that needs to play out over the US-China trade deal (why isn’t it signed yet?), most of the uncertainty entering the week has been removed!
What does the removal of these uncertainties mean for the markets?
It means they will once again start paying attention to what’s in our Week Ahead, rather than watching for exit polls and tweets.
It means people might actually care that there is a hammer on the daily USD/MXN chart and that price is diverging from the RSI. Even if this breakdown out of the long-term triangle is to hold, there is still room for the pair to bounce back up to the upward sloping trendline of the triangle near 19.3000.
Source: Tradingview, City Index
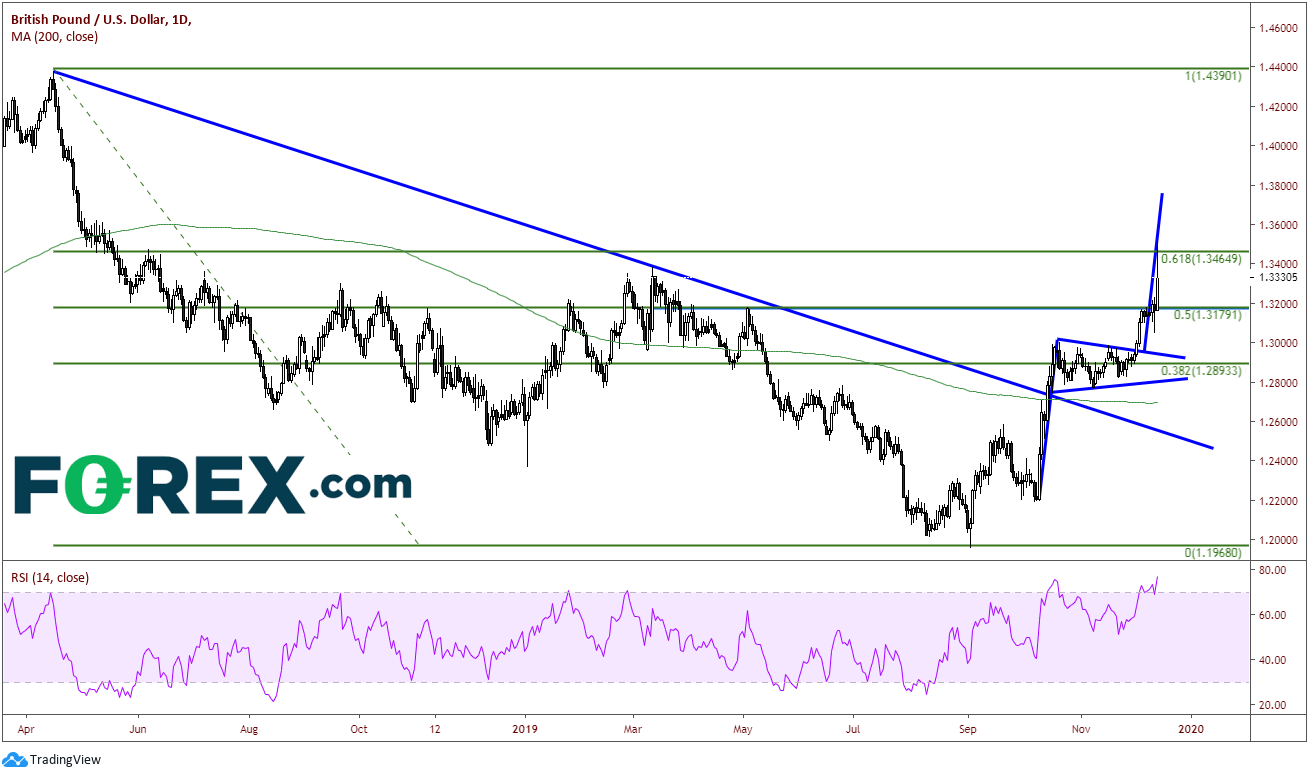
It means that although GBP/USD is pulling back a bit on the day after briefly trading above 1.3500, that traders may come in and buy on this dip and the flag pattern may play out to up near 1.3800. The RSI is overbought near 80, so a pullback towards 1.3200 would be normal to let the RSI unwind before price heads higher.
Source: Tradingview, City Index
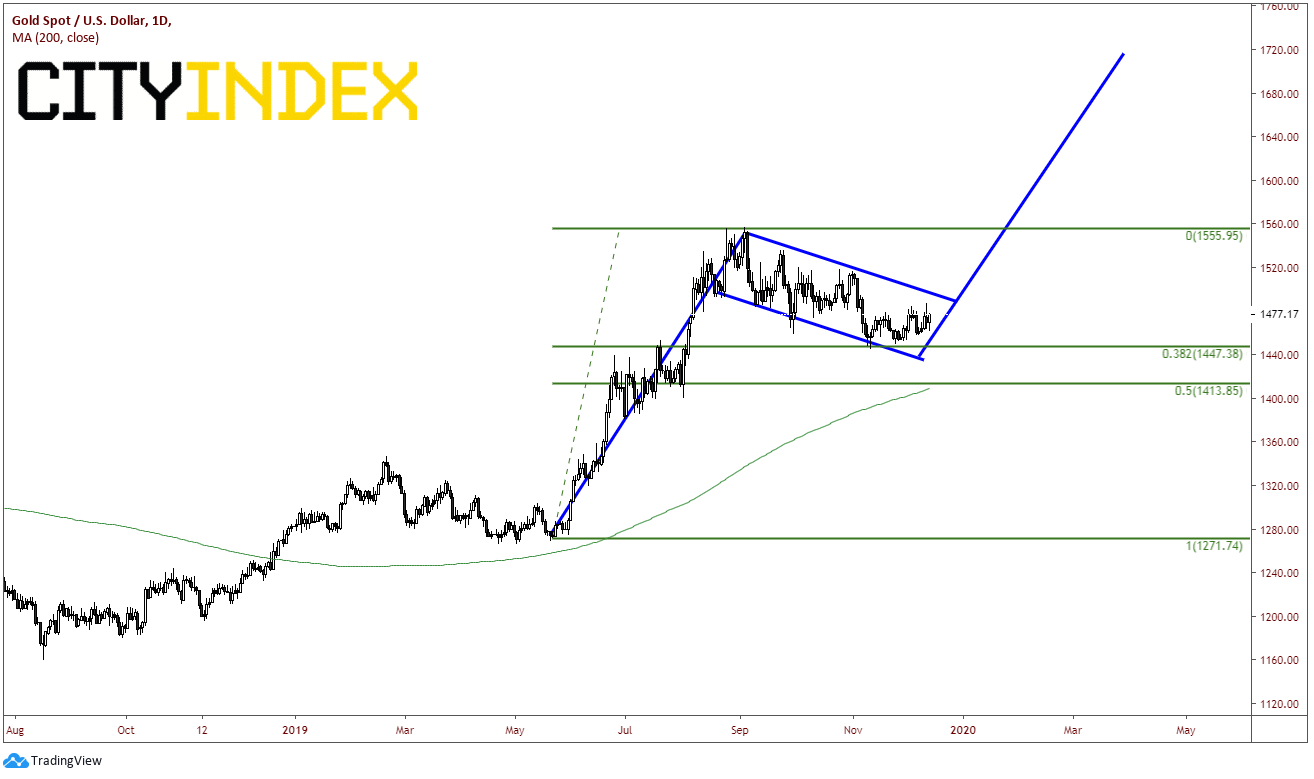
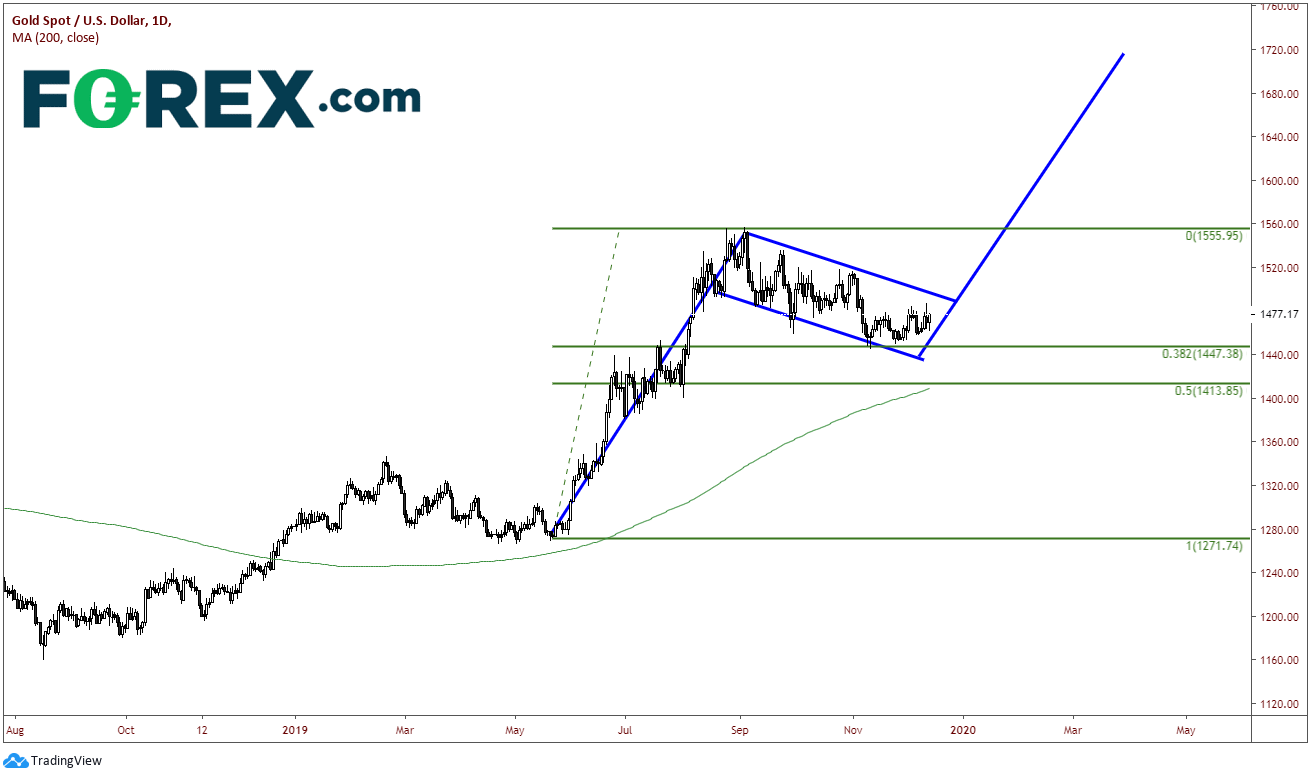
And it means that Gold could hold 1450, which is the 38.2% retracement level from the lows in late May to the highs in early September. And there is still a possibility for gold to break higher out of the flag formation and head up towards the target near 1720.
Source: Tradingview, City Index
Hopefully with many of these uncertainties out of the way, the markets will return to determining prices through price discovery, rather than through headlines.
Entering this past week, there were three very large elephants in the room that needed to be addressed:
1) Would the USMCA deal be reached?
2) What will be results of the UK elections?
3) Will the US and China sign a Phase One deal before tariffs go into effect on December 15th?
We now have the answers to 2 ½ of those questions, and perhaps the markets will start paying attention to the fundamentals and technicals again, rather than the drama. A USMCA deal was reached, Boris Johnson won the UK elections in a landslide victory, and the US and China “agreed in the text” to a trade deal which will result in the cancellation of the pending tariffs on December 15th. Although there is still some drama that needs to play out over the US-China trade deal (why isn’t it signed yet?), most of the uncertainty entering the week has been removed!
What does the removal of these uncertainties mean for the markets?
It means they will once again start paying attention to what’s in our Week Ahead, rather than watching for exit polls and tweets.
It means people might actually care that there is a hammer on the daily USD/MXN chart and that price is diverging from the RSI. Even if this breakdown out of the long-term triangle is to hold, there is still room for the pair to bounce back up to the upward sloping trendline of the triangle near 19.3000.
Source: Tradingview, Forex.com
It means that although GBP/USD is pulling back a bit on the day after briefly trading above 1.3500, that traders may come in and buy on this dip and the flag pattern may play out to up near 1.3800. The RSI is overbought near 80, so a pullback towards 1.3200 would be normal to let the RSI unwind before price heads higher.
Source: Tradingview, Forex.com
And it means that Gold could hold 1450, which is the 38.2% retracement level from the lows in late May to the highs in early September. And there is still a possibility for gold to break higher out of the flag formation and head up towards the target near 1720.
Source: Tradingview, Forex.com
Hopefully with many of these uncertainties out of the way, the markets will return to determining prices through price discovery, rather than through headlines.



The complete CFD trading experience
Award-winning platforms, competitive spreads, low commissions and dedicated support.
We live and breathe the markets and are dedicated to helping traders realise their ambitions as we continue to set the industry bar.
Economic calendar
Web Trader platform
Our sophisticated web-based platform is packed with features.
Related articles

AUD/USD Bulls Fight Back After Australian Jobs Shock
AUD/USD has been hit by another ugly Australian employment report, sending RBA rate hike expectations sharply lower. Yet the relationships driving the currency have shifted since quarter-end, and improving risk appetite could provide the fuel for a recovery.

Gold Price Short-term Outlook: XAU/USD Holds Critical Support as Breakout Nears 10 15 2026
Gold is consolidating after a steep selloff, with momentum divergence raising the stakes for the next move ahead of the Fed decision.


USD/JPY Update: Can the Japanese Yen Sustain Its Recovery?
Short-term price action around the Japanese yen has started to show some relative improvement over recent sessions. This can be seen in the recent performance of USD/JPY, which has now recorded three consecutive daily declines in favor of the Japanese currency, resulting in a depreciation of roughly 0.35% over the period.

StoneX Europe Ltd may make third party material available on this website which may contain information included but not limited to the conditions of financial markets. The material is for information purposes only and does not contain, and should not be construed as containing, investment advice and/or investment recommendation and/or an investment research and/or an offer of or solicitation for any transactions in financial instruments; any decision to enter into a specific transaction shall be made by the client following an assessment by him/her of their situation.
StoneX Europe Ltd makes no representation or warranty and assumes no liability as to the accuracy or completeness of the information provided, nor any loss arising from any investment based on a recommendation, forecast or other information supplied. You should always seek independent advice as to your suitability to speculate in any related markets and your ability to assume the associated risks, if you are at all unsure. We are not under any obligation to update any such material. Any opinion made may be personal to the author and may not reflect the opinion of StoneX Europe Ltd.