



Asian Open Lower yields didn’t help US equities
Bond yields moved lower for a second session, but it wasn’t enough to turn around bearish momentum on Wall Street, despite a positive start to the session.
Share this:

Thursday US cash market close:
- The Dow Jones Industrial fell -313.26 points (-0.89%) to close at 34,715.39
- The S&P 500 index fell -50.03 points (-1.11%) to close at 4,482.73
- The Nasdaq 100 index fell -201.386 points (-1.34%) to close at 14,846.46
Asian futures:
- Australia's ASX 200 futures are up 17 points (0.23%), the cash market is currently estimated to open at 7,359.40
- Japan's Nikkei 225 futures are down -290 points (-1.04%), the cash market is currently estimated to open at 27,482.93
- Hong Kong's Hang Seng futures are up 97 points (0.39%), the cash market is currently estimated to open at 25,049.35
- China's A50 Index futures are up 60 points (0.39%), the cash market is currently estimated to open at 15,559.52
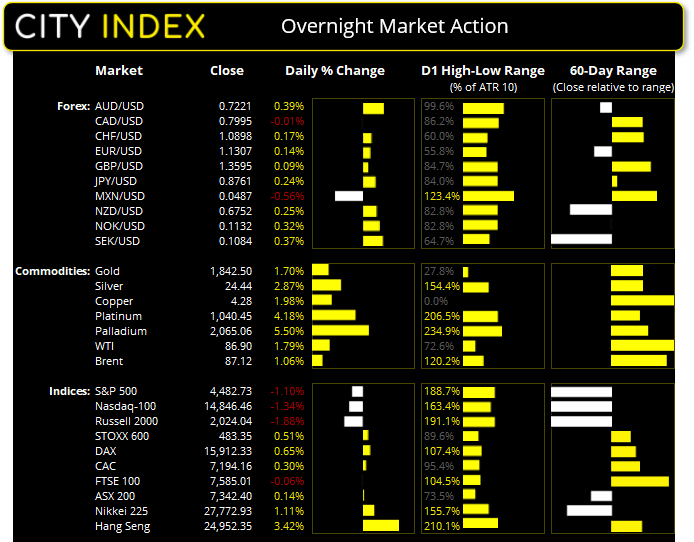
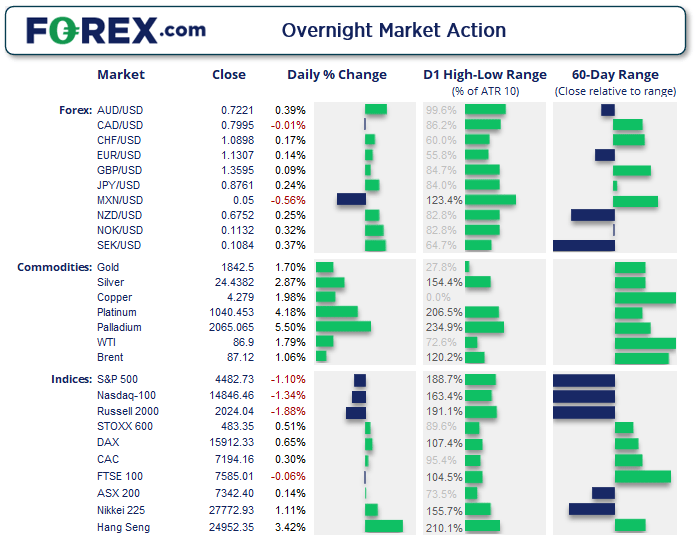
The Nasdaq 100 once again led the major US benchmarks lower, falling over -1.3% despite gapping higher and trading up around 1% earlier in the session. The S&P 500 was down -1.1% and the Dow around -0.9%. Peloton (PTON) fell over 20% after reports said they were pausing production to cut costs. United Airlines (UAL) and American Airlines (AAL) were also lower after they warned cost were to remain high despite expecting to increase passenger flights from March.
Futures markets across Asia point to a weak start for the tech-sensitive Nikkei 225, although futures markets for Australia and China have opened higher, likely due to the latest round if easing measures from PBOC yesterday.
EUR/JPY breaks out of bearish flag pattern
The euro was lower against all majors except the Kiwi dollar after the ECB’s December minutes reaffirmed their widely contested dovish view. EUR/USD formed a bearish engulfing candle on the daily chart and is also on track to form on the weekly.

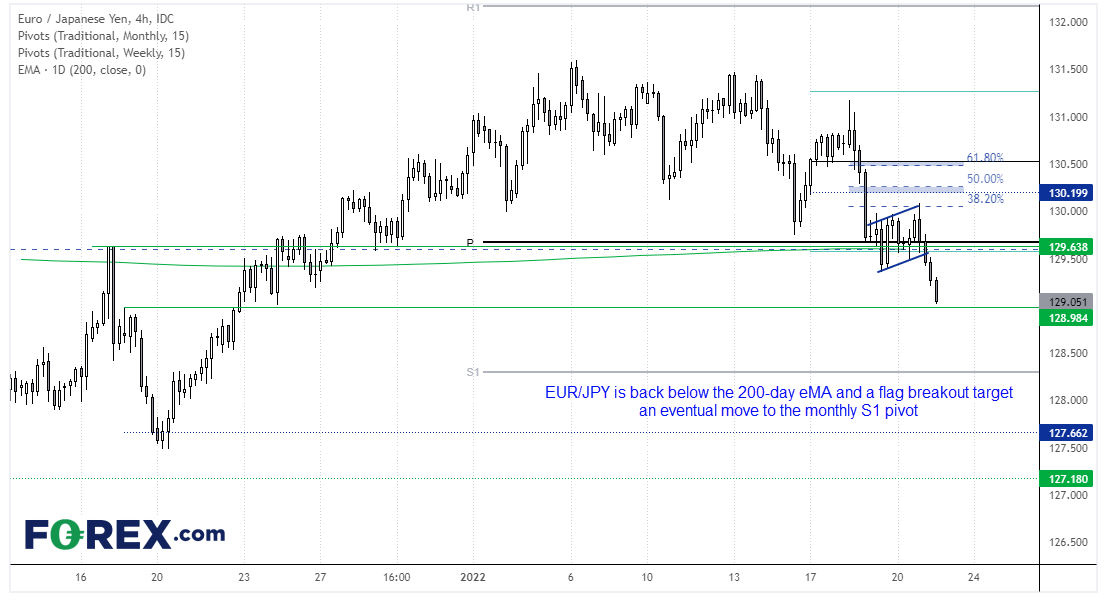
Among the euro crosses, EUR/JPY fell the hardest by around -0.5% and reached our initial target outlined in yesterday’s European open. Now the move has evolved it appears to be part of a flag breakout which projects a measured move to the monthly S1 pivot around 128.32. Given it currently trades around 129 which is a likely support level then we are on guard for a countertrend move initially. But if this is a flag breakout, we would not expect a strong round of bullish momentum before losses continue.
USD turns higher
The weaker euro allowed DXY to form a bullish engulfing candle on the daily chart at 95.52 support, which is constructive for the bull case. As is the fact we recently saw it rally from the September highs and reverse ack inside a lower keltner band. Dare we say it could now be headed for the highs around 97? Video to follow.
ASX200 touches a near-1-month low

The ASX 200 fell to a 19-day low yesterday, although it formed a Doji on the daily chart around a 61.8% Fibonacci level. And despite lower US equities the nearest futures contract for the S&P 200 is slightly higher. Assuming prices don’t selloff immediately at the open, we are on guard for a potential bounce over the near-term, yet our core view remains bearish below 7400 and for a move to the 7257 lows.
ASX 200: 7342.4 (0.14%), 20 January 2022
- Materials (2.99%) was the strongest sector and Telecomm Services (-1.23%) was the weakest
- 4 out of the 11 sectors closed higher
- 7 out of the 11 sectors closed lower
- 4 out of the 11 sectors outperformed the index
- 130 (65.00%) stocks advanced, 59 (29.50%) stocks declined
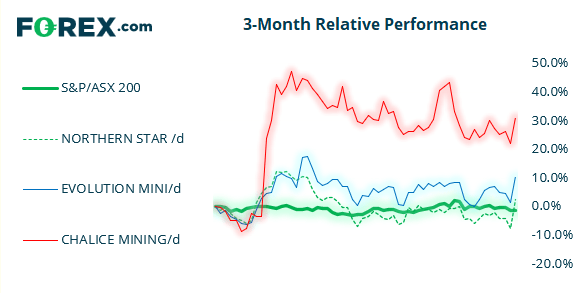
Outperformers:
- +11.2% - Northern Star Resources Ltd (NST.AX)
- +8.92% - Evolution Mining Ltd (EVN.AX)
- +7.46% - Chalice Mining Ltd (CHN.AX)
Underperformers:
- ·-9.91% - Summerset Group Holdings Ltd (SNZ.AX)
- ·-6.08% - Dicker Data Ltd (DDR.AX)
- ·-3.88% - Uniti Group Ltd (UWL.AX)
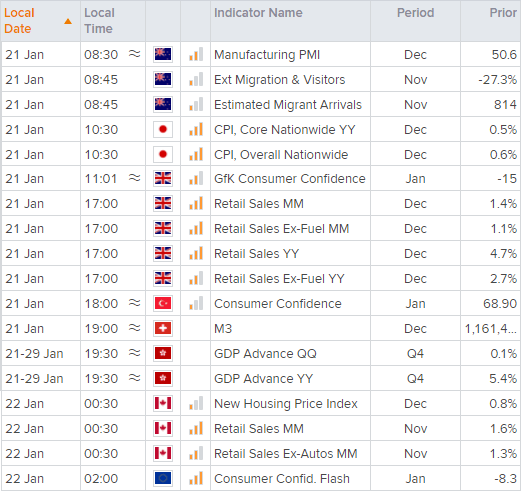
Up Next (Times in AEDT)
How to trade with City Index
You can easily trade with City Index by using these four easy steps:
- Open an account, or log in if you’re already a customer
• Open an account in the UK
• Open an account in Australia
• Open an account in Singapore
- Search for the company you want to trade in our award-winning platform
- Choose your position and size, and your stop and limit levels
- Place the trade
How to trade with FOREX.com
Follow these easy steps to start trading with FOREX.com today:
- Open a Forex.com account, or log in if you’re already a customer.
- Search for the pair you want to trade in our award-winning platform.
- Choose your position and size, and your stop and limit levels.
- Place the trade.
Related tags:
Latest market news



The complete CFD trading experience
Award-winning platforms, competitive spreads, low commissions and dedicated support.
We live and breathe the markets and are dedicated to helping traders realise their ambitions as we continue to set the industry bar.
Economic calendar
Web Trader platform
Our sophisticated web-based platform is packed with features.
Related articles
S&P 500 forecast: Stocks extend drop as correction risks grow
US and global equity markets have extended Wednesday’s sell-off, with Wall Street opening lower after a weak handover from Asia and Europe. The deterioration in risk appetite has been spreading across global markets. The dollar was firmer, Treasury yields were holding onto yesterday’s gains, while gold, silver and bitcoin were all under pressure alongside equities and major currencies.
Gold forecast: XAU/USD could take a larger dive after the big rise in yields
Gold prices have been falling in the last few days after last week’s post-FOMC pop faded amid rising interest rate expectations, higher oil prices and a strengthening US dollar. As before, I wasn’t convinced gold would thrive in the current macro backdrop.

USD/JPY outlook: Hawkish Fed recalibration pressures the yen
Stronger US growth momentum and rising Treasury yields are keeping USD/JPY pointed higher, even as Japanese policymakers try to limit the pressure building across domestic markets.

StoneX Europe Ltd may make third party material available on this website which may contain information included but not limited to the conditions of financial markets. The material is for information purposes only and does not contain, and should not be construed as containing, investment advice and/or investment recommendation and/or an investment research and/or an offer of or solicitation for any transactions in financial instruments; any decision to enter into a specific transaction shall be made by the client following an assessment by him/her of their situation.
StoneX Europe Ltd makes no representation or warranty and assumes no liability as to the accuracy or completeness of the information provided, nor any loss arising from any investment based on a recommendation, forecast or other information supplied. You should always seek independent advice as to your suitability to speculate in any related markets and your ability to assume the associated risks, if you are at all unsure. We are not under any obligation to update any such material. Any opinion made may be personal to the author and may not reflect the opinion of StoneX Europe Ltd.