

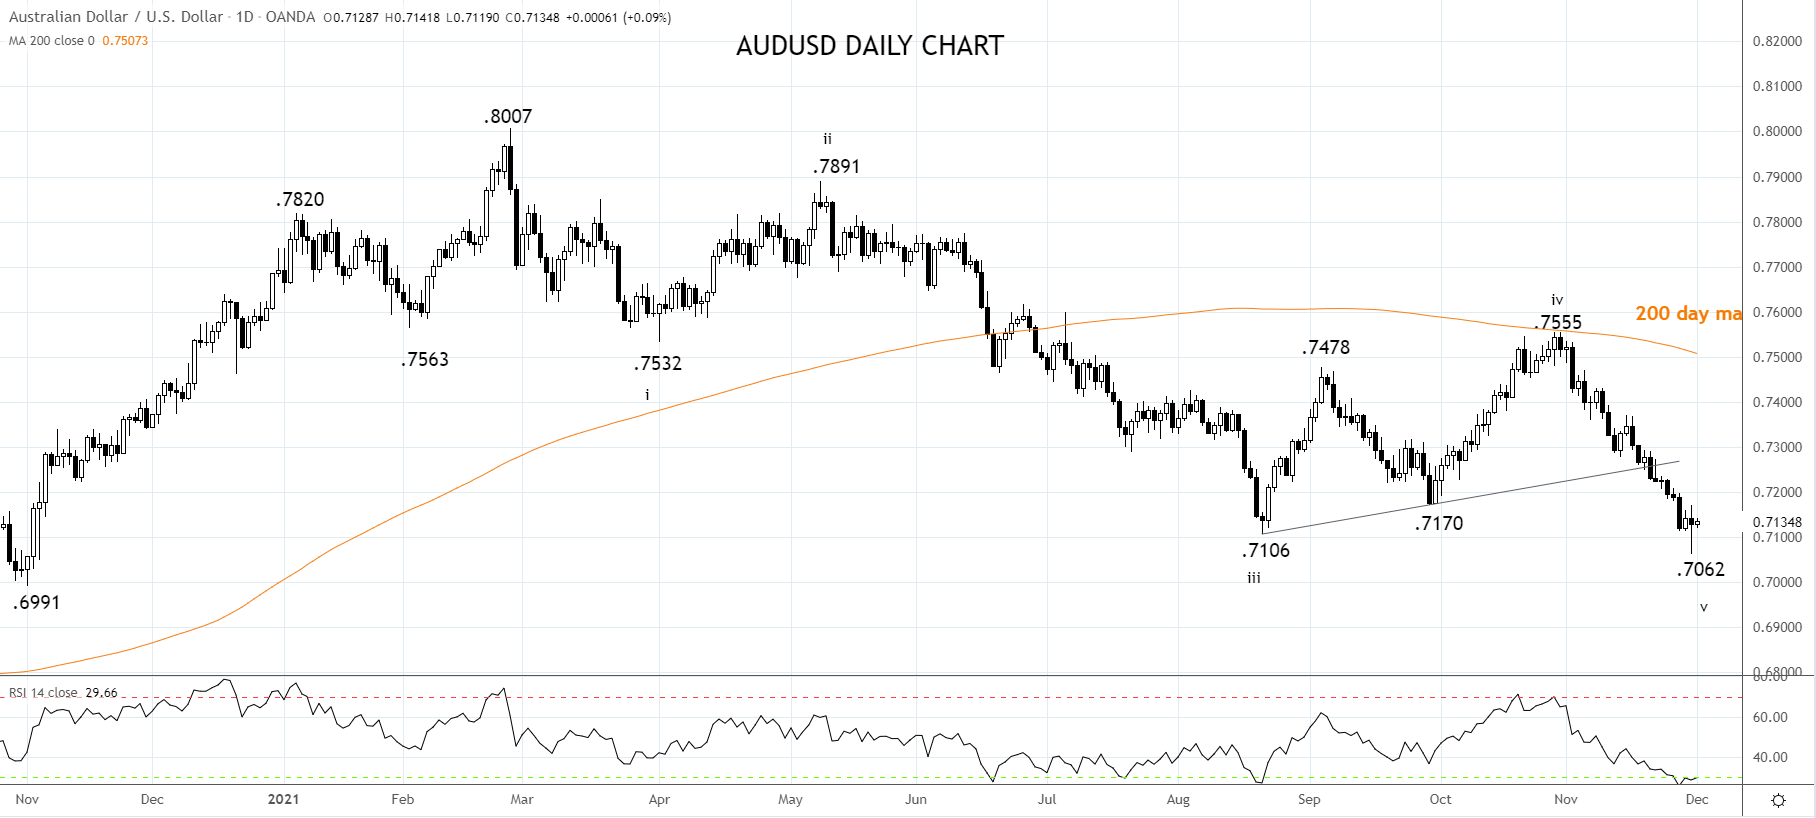


AU Q3 GDP beat boosts the AUDUSD
Australian Q3 GDP fell by -1.9%, significantly beating market expectations for a -2.7% fall. The fall is the first quarter of negative growth since the 6.8% fall recorded in the June Quarter of 2020 and means the Australian economy is once again smaller than where it was pre the onset of the pandemic.
Share this:

However, the better than expected print provides a welcome surprise after extended lockdowns in NSW, VIC, and the ACT and evidence of the strong momentum the economy took into the lockdown.
Notably, the household savings rate increased from 11.8% to 19.8% in Q3 as lockdown forced households to save more of their income. An indication that a wave of pent-up demand is ready to be unleashed into year-end and of a buffer should interest rates begin to rise earlier than forecast in 2022.
The main threat to the more optimistic outlook is the arrival of Omicron. Patience will be required as the scientific community assesses its severity, transmissibility, and current vaccines' efficacy.
Overnight the AUDUSD made a fresh cycle low at .7062 low. Perhaps wary of this and the uncertainty created by Omicron, gains in the AUDUSD have been modest post the data from .7125, up to a high of .7142.
Technically the new low, was the minimum downside requirement for a chart set up we have been following since Mid-October. And while it's too early to call the end of the down move, there are emerging signs of bullish divergence.
Should the AUDUSD trade above resistance at .7170/80, it would warn that a more substantial recovery back towards .7340 is likely before the downtrend resumes.
Source Tradingview. The figures stated areas of December 1st, 2021. Past performance is not a reliable indicator of future performance. This report does not contain and is not to be taken as containing any financial product advice or financial product recommendation
How to trade with City Index
You can trade with City Index by following these four easy steps:
- Open an account, or log in if you’re already a customer
• Open an account in the UK
• Open an account in Australia
• Open an account in Singapore
- Search for the company you want to trade in our award-winning platform
- Choose your position and size, and your stop and limit levels
- Place the trade
H
owever, the better than expected print provides a welcome surprise after extended lockdowns in NSW, VIC, and the ACT and evidence of the strong momentum the economy took into the lockdown.
Notably, the household savings rate increased from 11.8% to 19.8% in Q3 as lockdown forced households to save more of their income. An indication that a wave of pent-up demand is ready to be unleashed into year-end and of a buffer should interest rates begin to rise earlier than forecast in 2022.
The main threat to the more optimistic outlook is the arrival of Omicron. Patience will be required as the scientific community assesses its severity, transmissibility, and current vaccines' efficacy.
Overnight the AUDUSD made a fresh cycle low at .7062 low. Perhaps wary of this and the uncertainty created by Omicron, gains in the AUDUSD have been modest post the data from .7125, up to a high of .7142.
Technically the new low, was the minimum downside requirement for a chart set up we have been following since Mid-October. And while it's too early to call the end of the down move, there are emerging signs of bullish divergence.
Should the AUDUSD trade above resistance at .7170/80, it would warn that a more substantial recovery back towards .7340 is likely before the downtrend resumes.
Source Tradingview. The figures stated areas of December 1st, 2021. Past performance is not a reliable indicator of future performance. This report does not contain and is not to be taken as containing any financial product advice or financial product recommendation
- Open a Forex.com account, or log in if you’re already a customer.
- Search for the pair you want to trade in our award-winning platform.
- Choose your position and size, and your stop and limit levels.
- Place the trade.
Related tags:
Latest market news




The complete CFD trading experience
Award-winning platforms, competitive spreads, low commissions and dedicated support.
We live and breathe the markets and are dedicated to helping traders realise their ambitions as we continue to set the industry bar.
Economic calendar
Web Trader platform
Our sophisticated web-based platform is packed with features.
Related articles
EUR/USD Q4 2026 Outlook: Euro at a Crossroads as Fed, ECB Tighten 9 25 2026
EUR/USD enters Q4 at a pivotal inflection point as competing Fed-ECB policy paths and persistent inflation risks collide with major technical support.

USD/JPY Q4 2026 Outlook: Hawkish Fed Pricing Clashes With Intervention Risk
The year-end tug-of-war is clear: hawkish Fed pricing supports USD/JPY, while intervention risk limits the upside.


Japanese Yen Forecast: USD/JPY 4% Rally Challenges Post-Intervention Downtrend 9 24 2026
USD/JPY momentum has shifted sharply higher, putting a major resistance confluence in focus as U.S. and Japanese event risk builds.
StoneX Europe Ltd may make third party material available on this website which may contain information included but not limited to the conditions of financial markets. The material is for information purposes only and does not contain, and should not be construed as containing, investment advice and/or investment recommendation and/or an investment research and/or an offer of or solicitation for any transactions in financial instruments; any decision to enter into a specific transaction shall be made by the client following an assessment by him/her of their situation.
StoneX Europe Ltd makes no representation or warranty and assumes no liability as to the accuracy or completeness of the information provided, nor any loss arising from any investment based on a recommendation, forecast or other information supplied. You should always seek independent advice as to your suitability to speculate in any related markets and your ability to assume the associated risks, if you are at all unsure. We are not under any obligation to update any such material. Any opinion made may be personal to the author and may not reflect the opinion of StoneX Europe Ltd.