



AUD/USD, ASX 200 Analysis: Asian Open – 10th July 2023
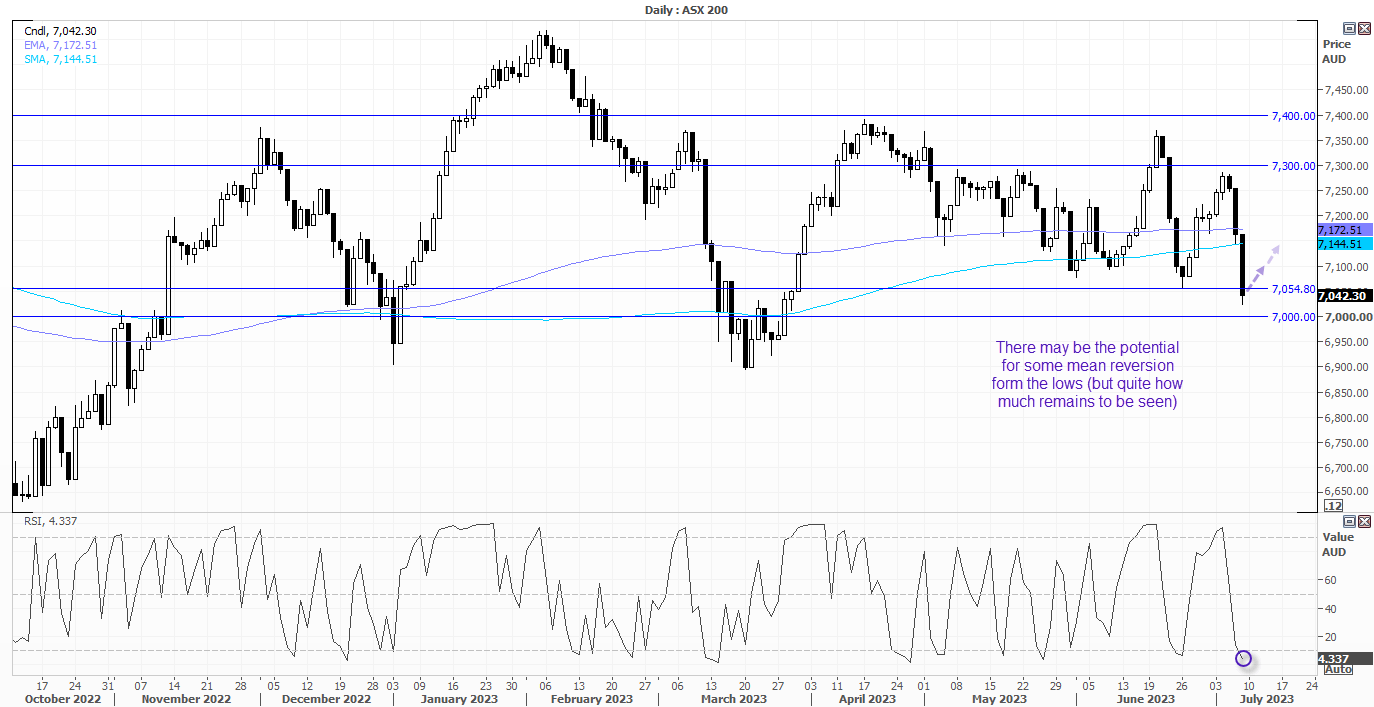
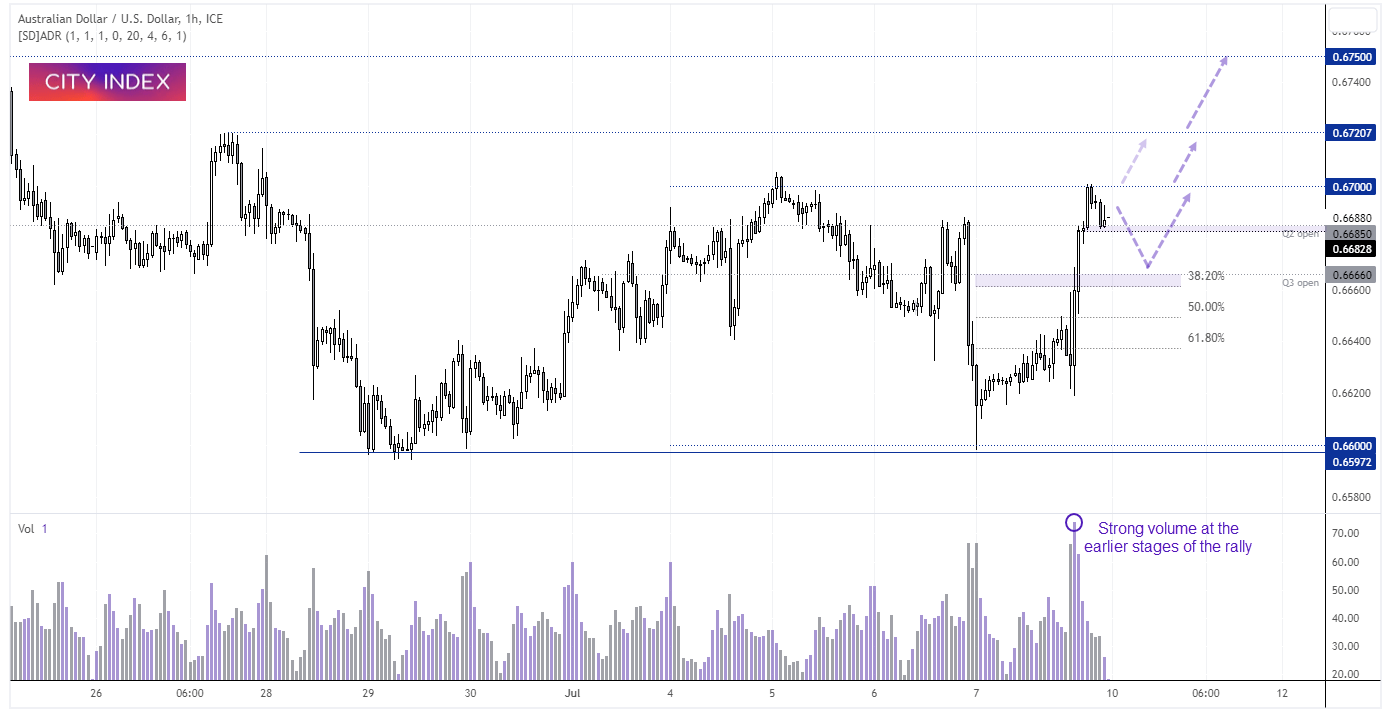
A weaker US dollar helped AUD/USD form a rally form 66c last week and tease us with a potential breakout. Whilst the ASX 200 is on the ropes, it shows the potential for some mean reversion higher (but by quite how far remains to be seen).
Share this:

Market summary
- Whilst Friday’s nonfarm payroll showed ‘only’ 209k jobs added compared to 225k expected and 306k prior, it’s still a healthy number that won’t deter the Fed from hiking further. Especially with unemployment at 3.6%
- Wall Street initially rallied but was unable to hold onto gains, closing slightly lower on Friday
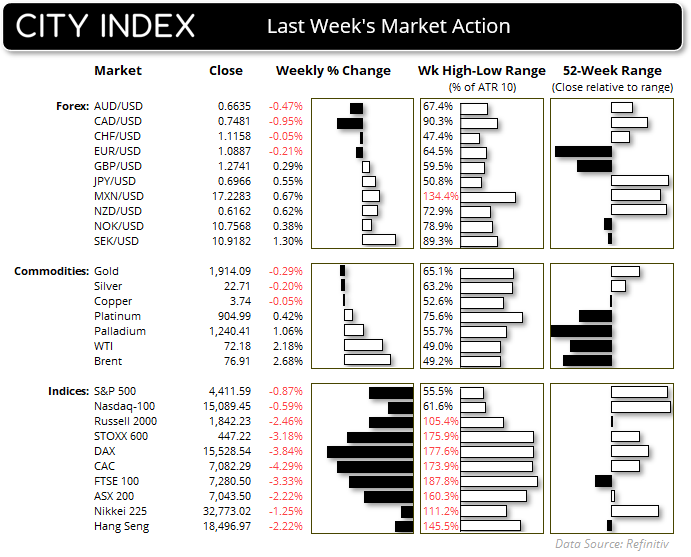
- But the slower jobs number weighed on the US dollar which was the weakest forex major on Friday and second of last week (that title goes to the Canadian dollar)
- Fed fund futures now imply a 93% chance of a Fed hike this month, and for that to be the final hike of the cycle
- A strong employment report for Canada saw USD/CAD form a bearish engulfing day and bearish hammer on the weekly chart
- The Japanese yen continued to broadly strengthen on Friday, sending USD/JPY to a 2-week low just shy of 421, during its worst day in two months (and closing with a bearish engulfing week)
- EUR/USD closed at an 8-day high and now trades less than a days’ average range away from the 1.1012 high
- GBP/USD reached our 1.2800 target outlined last week, and shows the potential to break above the June high and make a run for the 1.30 handle
- USD/CHF accelerated lower after rolling over from 0.90 resistance on Thursday, and shows the potential to probe the YTD low of 0.8820
- WTI crude oil is also rallying which could make the increasingly short speculators question their positioning, with oil now showing the potential to retrace and potentially break above $75
Events in focus (AEDT):
- View The Week Ahead for a look at this week’s economic data and themes
- 09:50 – Japan’s current account, bank lending
- 11:30 – Australian building approvals (revised), business turnover
- 11:30 – China CPI, PPI
- Fed members speak (Daly 00:00, Mester 01:00, Bostic 02:00)
ASX 200 at a glance:
- 92% of the ASX 200 stocks declined on Friday during its worst day for four months
- A bearish engulfing / outside week formed
- Although the market held above 7,000 – a key line of defence for bulls to defend
- SPI 200 futures were 0.36% higher by Friday’s close
- The ASX is expected to open above the June 26th low today
- Potential for some mean reversion (7100 and 7145 are nearby resistance levels)


AUD/USD 1-hour chart:
AUD/USD formed a small bullish hammer for a second consecutive week, and last week’s candle was a bullish inside week. The weekly candles also show a double bottom around 0.66, and Friday’s bullish engulfing candle forms a higher low on the intraday charts and has taken prices to the top of its 0.66 – 0.67 range. Basically, demand is building which suggests a bullish breakout is on the cards. However, Friday’s rally looks stretched over the near-term, and we’d prefer to see prices retrace further and seek evidence of a swing low (such as the support zone around 0.6660) ahead of an anticipated break higher. A softer US inflation report (Tuesday US, Wednesday AM Australia) could certainly help with the bullish case.

-- Written by Matt Simpson
Follow Matt on Twitter @cLeverEdge
How to trade with City Index
You can trade with City Index by following these four easy steps:
- Open an account, or log in if you’re already a customer
• Open an account in the UK
• Open an account in Australia
• Open an account in Singapore
- Search for the market you want to trade in our award-winning platform
- Choose your position and size, and your stop and limit levels
- Place the trade
Related tags:
Latest market news




The complete CFD trading experience
Award-winning platforms, competitive spreads, low commissions and dedicated support.
We live and breathe the markets and are dedicated to helping traders realise their ambitions as we continue to set the industry bar.
Economic calendar
Web Trader platform
Our sophisticated web-based platform is packed with features.
Related articles

Oil Quietly Hands the Fed a Reason to Stay Hawkish
Oil prices and the U.S. dollar are both on the front foot as elevated energy costs feed Fed warnings that inflation may prove sticky.


S&P 500 forecast: Stocks extend drop as correction risks grow
US and global equity markets have extended Wednesday’s sell-off, with Wall Street opening lower after a weak handover from Asia and Europe. The deterioration in risk appetite has been spreading across global markets. The dollar was firmer, Treasury yields were holding onto yesterday’s gains, while gold, silver and bitcoin were all under pressure alongside equities and major currencies.

Gold forecast: XAU/USD could take a larger dive after the big rise in yields
Gold prices have been falling in the last few days after last week’s post-FOMC pop faded amid rising interest rate expectations, higher oil prices and a strengthening US dollar. As before, I wasn’t convinced gold would thrive in the current macro backdrop.
StoneX Europe Ltd may make third party material available on this website which may contain information included but not limited to the conditions of financial markets. The material is for information purposes only and does not contain, and should not be construed as containing, investment advice and/or investment recommendation and/or an investment research and/or an offer of or solicitation for any transactions in financial instruments; any decision to enter into a specific transaction shall be made by the client following an assessment by him/her of their situation.
StoneX Europe Ltd makes no representation or warranty and assumes no liability as to the accuracy or completeness of the information provided, nor any loss arising from any investment based on a recommendation, forecast or other information supplied. You should always seek independent advice as to your suitability to speculate in any related markets and your ability to assume the associated risks, if you are at all unsure. We are not under any obligation to update any such material. Any opinion made may be personal to the author and may not reflect the opinion of StoneX Europe Ltd.