




AUD/USD, S&500 analysis: Asian Open – Nov 13, 2013
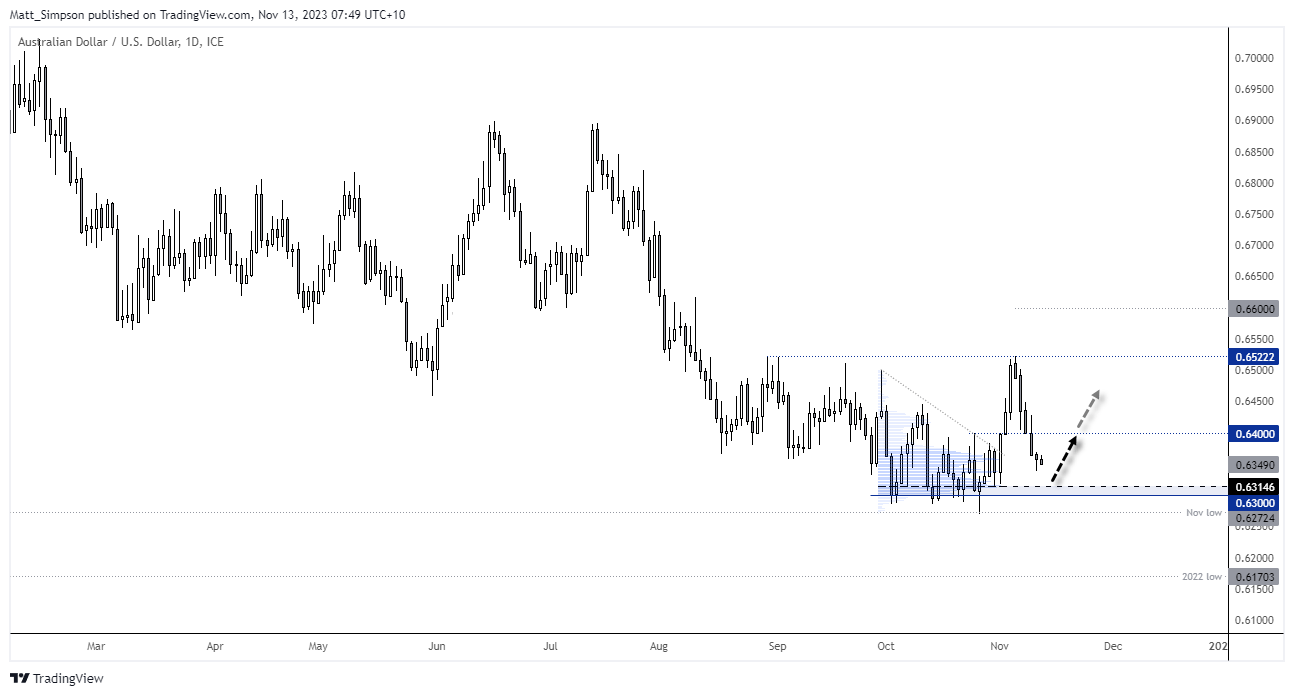
The S&P 500 continues to defy gravity and appears on the cup of breaking above a key resistance level. And whilst AUD/USD fell for five days last week, it is fast approaching a key support level that has been favourable to dip buyers in recent times.
Share this:

Market Summary:
- Moody’s ratings agency downgraded their credit rating for the US to negative from stable, due to large fiscal deficits and weakening debt affordability
- Market pricing in early Asian trade has taken the downgrade within its stride
- The Nasdaq 100 has posted gains over the past 18 Mondays (and the S&P 500 have posted gains 17 of the past 18). With no immediate explanation as to why, we now wait to see if it can add to the impressive winning streak
- Joe Biden says he wants the US and China to re-establish military ties, ahead of their face to face meeting on Wednesday
- The Australian dollar was the weakest forex major last week, following a less-hawkish than expected RBA hike. The Aussie also fell for five consecutive days and closed beneath 64c
- WTI crude oil enjoyed its best day of the week on Friday after finding support at $75 (one of my bearish targets). It also formed a 3-day bullish reversal pattern called a morning star formation. As it has now fallen for three weeks and in a relatively straight line, I’m happy to step aside and stay flat.
- Gold fell for a second consecutive week and closed beneath the September high, although the 38.2% Fibonacci ratio between the October high and low is acting as support.
Events in focus (AEDT):
- Publish holiday in Singapore (Diwali)
- 08:30 – New Zealand Performance of Services index
- 10:50 – Japan producer prices
- 17:00 – Japan machine tool orders
- 19:00 – China new loans, outstanding loan growth, total social financing, M2 money supply
- 22:55 – BOE Breeden speaks
ASX 200 at a glance:
- The ASX 200 posted a minor loss last week, and spent most of the week meandering around 7,000
- SPI futures and Wall Street’s gains on Friday suggest a positive open for the ASX cash index today
- Yet its indecision around the 7,000 area make it a difficult market to have a bias on, particularly as the daily ranges have been smaller than usual
- Therefore, my bias is neutral until volatility returns and momentum tips its hand
S&P 500 technical analysis (daily chart):
The S&P 500 has risen over 7% since the late-October low, and in it has done so in a relatively straight line. There was a slight consolidation last week, although Friday’s strong bullish candle suggests its ready for its next leg higher. Whilst the S&P 500 closed above gap resistance, the trendline capped its upside. Therefore, bulls can either with for a break above Friday’s high to assume bullish continuation, or wait to see if prices pull back and respect a support level before seeking to buy the dip (in anticipation of a breakout).
AUD/USD technical analysis (daily chart):
This is on the scrappy side, but AUD/USD’s ability to hold above the 63c area despite data and headlines suggesting it should have broken lower already should not be ignored. A small bullish hammer formed on Friday, and as it has fallen for five consecutive days then odds suggest we maybe nearing an up day. Any pullbacks towards 63c / 0.6314 (the most traded prices during the prior consolidation) will pique my bullish interest for a initial move to 64c. A break above which brings 0.6450 into focus.
View the full economic calendar
View the full economic calendar
-- Written by Matt Simpson
Follow Matt on Twitter @cLeverEdge
How to trade with City Index
You can trade with City Index by following these four easy steps:
- Open an account, or log in if you’re already a customer
• Open an account in the UK
• Open an account in Australia
• Open an account in Singapore
- Search for the market you want to trade in our award-winning platform
- Choose your position and size, and your stop and limit levels
- Place the trade
Related tags:
Latest market news




The complete CFD trading experience
Award-winning platforms, competitive spreads, low commissions and dedicated support.
We live and breathe the markets and are dedicated to helping traders realise their ambitions as we continue to set the industry bar.
Economic calendar
Web Trader platform
Our sophisticated web-based platform is packed with features.
Related articles
USD/JPY Q4 2026 Outlook: Hawkish Fed Pricing Clashes With Intervention Risk
The year-end tug-of-war is clear: hawkish Fed pricing supports USD/JPY, while intervention risk limits the upside.
Japanese Yen Forecast: USD/JPY 4% Rally Challenges Post-Intervention Downtrend 9 24 2026
USD/JPY momentum has shifted sharply higher, putting a major resistance confluence in focus as U.S. and Japanese event risk builds.


Oil Quietly Hands the Fed a Reason to Stay Hawkish
Oil prices and the U.S. dollar are both on the front foot as elevated energy costs feed Fed warnings that inflation may prove sticky.

StoneX Europe Ltd may make third party material available on this website which may contain information included but not limited to the conditions of financial markets. The material is for information purposes only and does not contain, and should not be construed as containing, investment advice and/or investment recommendation and/or an investment research and/or an offer of or solicitation for any transactions in financial instruments; any decision to enter into a specific transaction shall be made by the client following an assessment by him/her of their situation.
StoneX Europe Ltd makes no representation or warranty and assumes no liability as to the accuracy or completeness of the information provided, nor any loss arising from any investment based on a recommendation, forecast or other information supplied. You should always seek independent advice as to your suitability to speculate in any related markets and your ability to assume the associated risks, if you are at all unsure. We are not under any obligation to update any such material. Any opinion made may be personal to the author and may not reflect the opinion of StoneX Europe Ltd.