



Bitcoin, Nasdaq Price Outlook: Hormuz Risks Remain the Key Resistance for Risk Assets
Bitcoin, Nasdaq price outlook: Hormuz risks remain the key resistance capping market gains as weekend negotiations reach a stalemate, keeping Bitcoin below 75,000 and the Nasdaq below 25,200. The next phase of developments includes a US blockade over Hormuz, further constraining global energy flows and supply chains.
Share this:

Hormuz-related risks continue to cap upside momentum across risk assets, as stalled negotiations maintain elevated uncertainty. This environment is keeping Bitcoin below the 75,000 level and the Nasdaq below the 25,200 resistance zone.
From a market positioning perspective, global appetite to capitalize on recent dips remains strong. However, headline-driven sentiment continues to dominate, introducing significant noise and limiting sustained breakouts. Risk assets remain capped below key resistance levels that define longer-term directional bias, as Hormuz-related disruptions ripple through global supply chains and support elevated crude oil prices (see Q2 2026 crude oil outlook for further details).
The longer this situation persists, the more inflationary pressures are expected to build—supporting the US dollar and interest rates, while weighing on broader market gains, until a clearer diplomatic alignment emerges between the US and Iran.
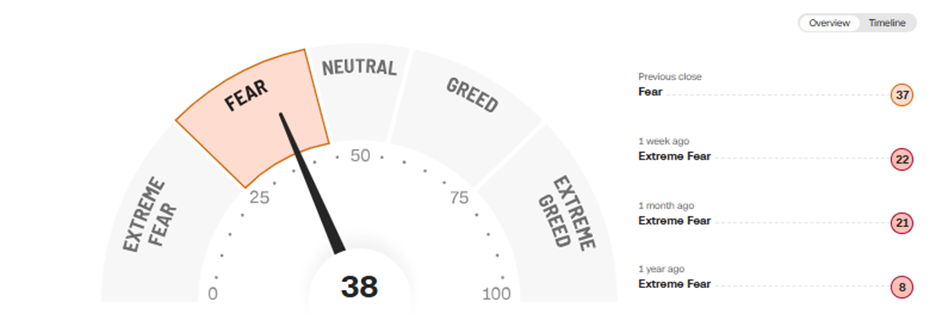
CNN Fear and Greed Index
Source: CNN
Market sentiment has improved notably following initial signs of negotiations, rebounding from lows last seen in April 2025 during tariff-related volatility. However, current conditions remain significantly more volatile, reducing the likelihood of a similar recovery pattern.
This cautious positioning is reflected in the Fear and Greed Index, which remains just below neutral levels, highlighting hesitation near key resistance zones.
Key charts to watch
- DXY: Resistance at 100.60 | Support at 98
- Crude Oil: Resistance at 115 | Support at 88
- Nasdaq: Resistance at 25,200–25,500 | Support at 24,200 and 23,800 (Click here for the US Indices Outlook)
- Bitcoin: Resistance at 75,000 | Support at 60,000
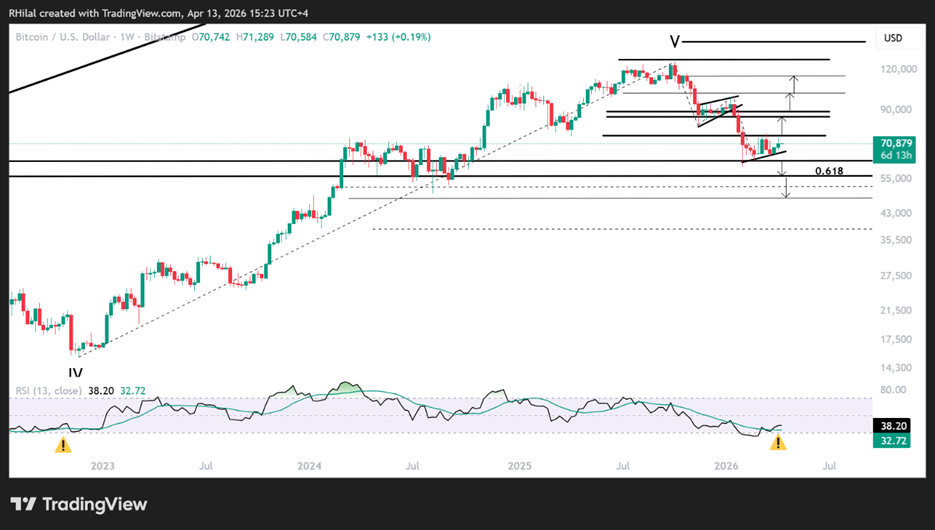
Bitcoin Price Outlook: Weekly Time Frame – Log Scale
Source: Trading view
The Bitcoin chart highlights several factors supporting a longer-term recovery, alongside a key risk that could drive another leg lower before a broader shift.
Scenario for further upside
- Holding above the 60,000 psychological level and the 0.618 Fibonacci retracement of the 2022–2025 uptrend
- Trading near the 2021 highs, now acting as support
- Approaching the projected target of the November 2025–January 2026 wedge pattern
- Weekly RSI rebounding from oversold levels last seen in 2022
The outlook remains neutral, with a confirmed close above 75,000 needed to support a move toward 80,000–89,000, followed by 100,000–115,000. A sustained extension could open the path toward the 130,000–200,000 range.
Scenario for further downside
As geopolitical uncertainty persists, a renewed risk-off move with a close below 60,000 could expose the 56,000 and 48,000 zones, which may act as longer-term accumulation areas.
The consolidation since February 2026 may also be forming a short-term head and shoulders continuation pattern, awaiting neckline confirmation for a potential extension lower
Nasdaq Price Outlook: Weekly Time Frame – Log Scale

Source: Trading view
In line with broader US equity markets, price action across the Nasdaq reflects the move between April 2025 lows, January 2026 highs, and March 2026 lows, currently holding near the 23.6% Fibonacci retracement level.
This positioning suggests short-term pullback risks, reinforced by extended Hormuz tensions and rising inflation pressures, within a broader longer-term uptrend.
Upside scenario
A resolution between the US and Iran could support a move above the 25,200–25,500 zone, opening the path toward 25,800 and 26,500. This may then lead to either a pullback or further extension toward the 50% and 61.8% Fibonacci levels at 27,700 and 28,800.
Downside scenario
Currently, downside risks remain dominant. A move below 24,600, followed by 24,200 and 23,800, could trigger a deeper decline toward the 2024 highs near 22,100, where longer-term buying interest may emerge.
Written by Razan Hilal, CMT
Follow on X: @Rh_waves
Latest market news




The complete CFD trading experience
Award-winning platforms, competitive spreads, low commissions and dedicated support.
We live and breathe the markets and are dedicated to helping traders realise their ambitions as we continue to set the industry bar.
Economic calendar
Web Trader platform
Our sophisticated web-based platform is packed with features.
Related articles
AUD/USD hammered by US yields and fading RBA hike bets
US yields, dollar strength and fading RBA hike bets have combined to drive AUD/USD to fresh multi-month lows. The macro and technical bias remains bearish, although history suggests parts of the move are now reaching unusually stretched levels.
Canadian Dollar Forecast: USD/CAD Four-Week Rally Eyes Yearly Highs 9 30 2026
USD/CAD has advanced in 14 of the past 15 sessions, but stretched momentum raises the stakes as major resistance and NFP come into focus.


Nasdaq Breakout Potential into Q4 for Melt Up Scenarios
The headlines seem negative in almost any place that you look, with surging Treasury yields and frothy AI valuations getting more and more attention. But, if it’s so bad, why hasn’t the Nasdaq melted down yet, even as the Fed has started hiking rates?

StoneX Europe Ltd may make third party material available on this website which may contain information included but not limited to the conditions of financial markets. The material is for information purposes only and does not contain, and should not be construed as containing, investment advice and/or investment recommendation and/or an investment research and/or an offer of or solicitation for any transactions in financial instruments; any decision to enter into a specific transaction shall be made by the client following an assessment by him/her of their situation.
StoneX Europe Ltd makes no representation or warranty and assumes no liability as to the accuracy or completeness of the information provided, nor any loss arising from any investment based on a recommendation, forecast or other information supplied. You should always seek independent advice as to your suitability to speculate in any related markets and your ability to assume the associated risks, if you are at all unsure. We are not under any obligation to update any such material. Any opinion made may be personal to the author and may not reflect the opinion of StoneX Europe Ltd.