



Bitcoin takes the baton as BTC/USD breaks higher
Bitcoin is heating up again, with BTC/USD breaking higher as momentum fades across the AI and semiconductor space.
Share this:

- Bitcoin may be taking the speculative baton as semi spaces cools
- Dollar debasement concerns and Clarity Act hopes add support
- $73,500–$74,500 zone in focus
From semis back to crypto?
Bitcoin’s latest surge has, at face value, two obvious catalysts. The first is renewed concern about dollar debasement following the US Treasury’s decision to double long bond buybacks, a move that has been seen as another attempt to cap the rise in long-end yields.
The second is growing optimism that the Clarity Act will eventually pass Congress, helping to create a more crypto-friendly environment in the United States. I’ve no doubt both are contributing to the move.
But I think there may be something else going on that people are missing.
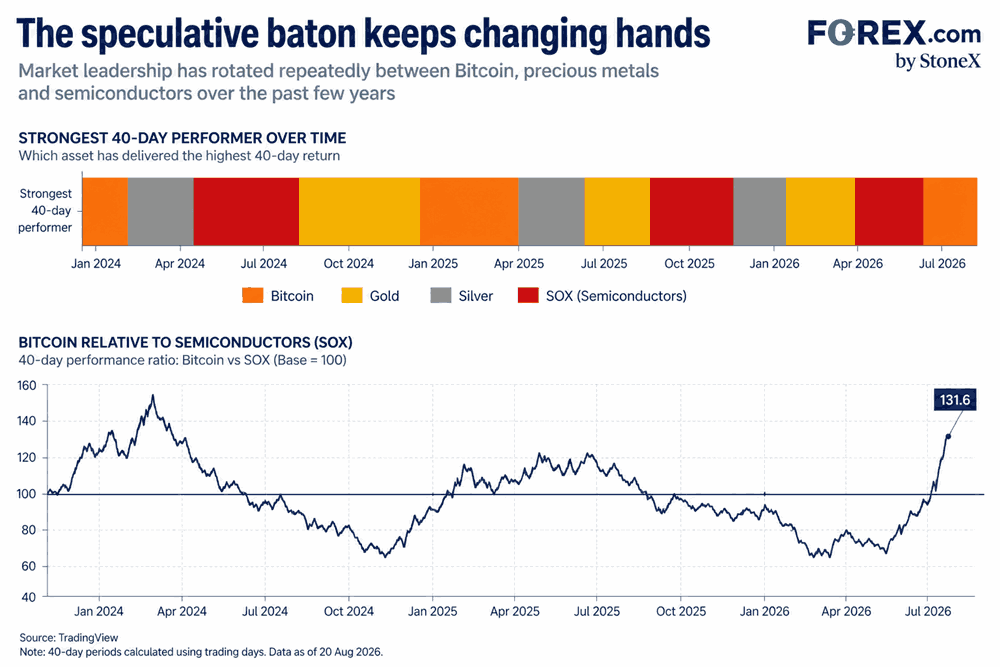
If you look back beyond the super short term, there has been an obvious pattern over recent years where momentum-driven, hyper-speculative behaviour has shifted from one market to another. Crypto has had its run, gold and silver have had theirs, and more recently the AI and semiconductor trade became the hot place to be.
Source: LSEG, FOREX.com
However, now that bullish momentum in the semi space has stalled, I wonder whether we may be seeing the speculative baton handed back to crypto. That doesn’t mean money is literally being yanked from semi stocks and shoved straight into Bitcoin, and the data can’t prove that. But as the graphic above shows, “momo” leadership has repeatedly rotated between Bitcoin, precious metals and semiconductors over recent years, with traders gravitating towards whichever market had been the hottest at the time.
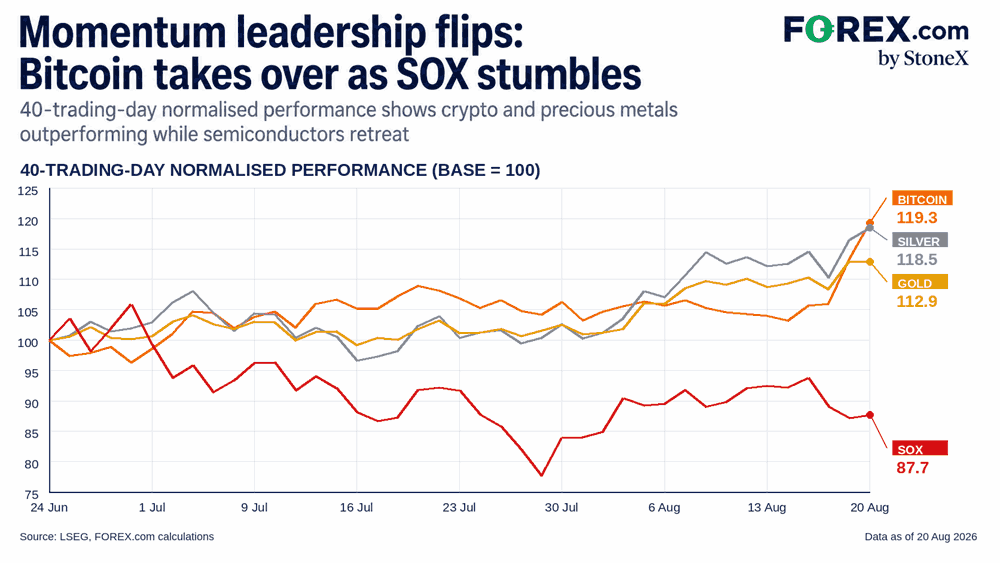
The latest shift, shown below, has been particularly abrupt. Over the past 40 trading days, Bitcoin has risen 19.3%, silver 18.5% and gold 12.9%, while the SOX semiconductor index has fallen 12.3%. SOX had been the strongest 40-day performer for 64 consecutive trading sessions through late July, but that dominance has now unwound, with Bitcoin taking over as the strongest performer of the group.
Source: LSEG, FOREX.com
The question is whether this is simply another short-lived burst of crypto enthusiasm, or whether the market’s speculative attention is starting to migrate again. Bitcoin’s abrupt breakout this week, coming just as it takes over leadership from semis, provides a complementary signal that another shift in momentum leadership may already be underway.
BTC/USD probes major technical zone
Source: TradingView
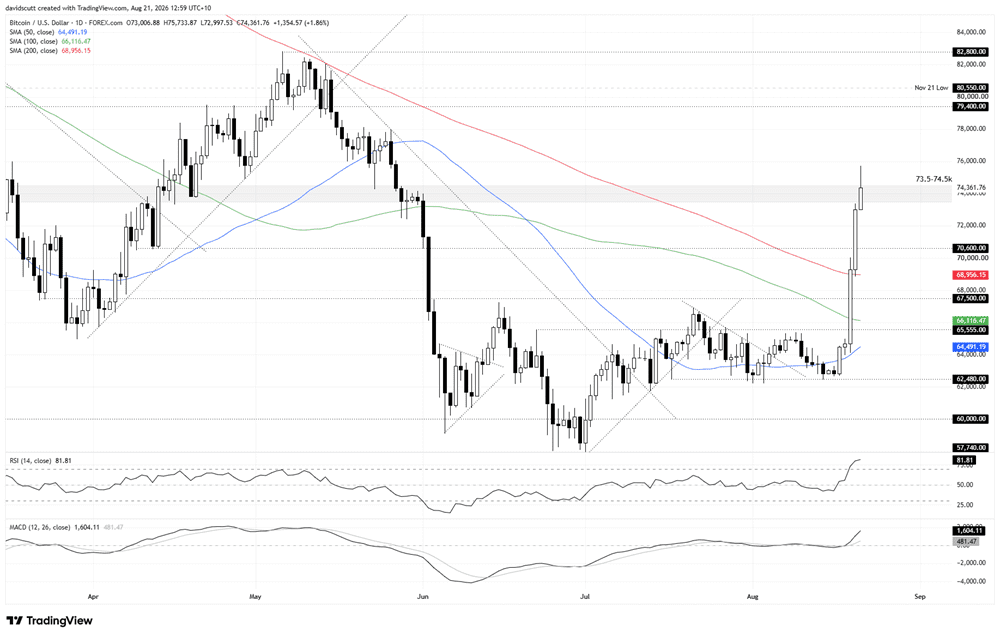
Having bounced in a narrow range between $65,555 and $62,480 for several weeks, Bitcoin’s bullish breakout has seen it not only take out the 200-day moving average, but then push back into what has been an important technical zone going back several years between $73,500 on the downside and $74,500 on the upside. It has been the launchpad for some significant market moves over the years, including major breakouts, sharp bounces and outright rejections, making it an important reference point when judging whether to chase or fade the latest surge.
We’ve already seen one push in Asia above the top of the zone, which at this point has ended in failure. Price action towards the close may be more instructive than intraday movements when judging which way to trade it.
The message from the oscillators is entirely bullish. RSI (14) has jackknifed higher and now sits in overbought territory at 82, while MACD has crossed the signal line and is diverging sharply higher in positive territory, confirming that bullish momentum behind the move is strong. Other indicators, such as ATR 14 stretch and Bollinger Bands, also sit at extreme levels, raising the risk of reversal if the price cannot break and hold above the zone.
Given the current trajectory, levels in focus above the zone include $79,400, which has repeatedly acted as support and resistance this year, followed by the March swing high of $82,800. On the downside, $70,600, the 200-day moving average and $67,500 are the immediate levels of note.
While the price action and oscillators are delivering a uniformly bullish signal, confirmation via a sustained break above the zone, ideally during a period when market volumes are stronger, would provide greater confidence that the move has further to run.
Related tags:
Latest market news




The complete CFD trading experience
Award-winning platforms, competitive spreads, low commissions and dedicated support.
We live and breathe the markets and are dedicated to helping traders realise their ambitions as we continue to set the industry bar.
Economic calendar
Web Trader platform
Our sophisticated web-based platform is packed with features.
Related articles
Crypto Outlook: Altcoins Lead the Rally as Bitcoin Pauses
With only a few days left in September, the cryptocurrency market continues to show a constructive short-term outlook. The latest trading week has delivered meaningful gains across most major digital assets and, broadly speaking, the bullish bias remains the dominant force within the market.
S&P 500, Nasdaq, Dow Forecast: Wall Street Split Widens Into Month-End 9 26 2026
Nasdaq strength contrasts with mounting Dow pressure as rising Treasury yields raise the stakes for stocks heading into the monthly close.

EUR/USD weekly outlook: Oil, inflation and NFP in focus
After coming under significant pressure in recent weeks, the EUR/USD came off its lows to finish the week on a positive note on Friday, albeit with only a mild rebound. That was not enough to prevent the exchange rate falling for the third consecutive week, as the US dollar and bond yields rallied across the board.

StoneX Europe Ltd may make third party material available on this website which may contain information included but not limited to the conditions of financial markets. The material is for information purposes only and does not contain, and should not be construed as containing, investment advice and/or investment recommendation and/or an investment research and/or an offer of or solicitation for any transactions in financial instruments; any decision to enter into a specific transaction shall be made by the client following an assessment by him/her of their situation.
StoneX Europe Ltd makes no representation or warranty and assumes no liability as to the accuracy or completeness of the information provided, nor any loss arising from any investment based on a recommendation, forecast or other information supplied. You should always seek independent advice as to your suitability to speculate in any related markets and your ability to assume the associated risks, if you are at all unsure. We are not under any obligation to update any such material. Any opinion made may be personal to the author and may not reflect the opinion of StoneX Europe Ltd.