





Can the easing of supply chain pressures give CPI a break?
With key US inflation data scheduled for tomorrow, we take a look behind the curtain to see if it’s realistic to expect inflation to finally tail off.
Share this:

US inflation is expected to fall from a whopping 8.5% y/y to a (still very high) 8.1%. On the monthly basis the consensus is for a 0.2% gain compared with 1.2% previously. If this is the case, it’s likely we’ll see a slurry of ‘inflation has peaked’ headlines, and the dollar may even move lower as the Fed are presumably under less pressure to take runaway inflation. However, today we’ll take a bigger picture view on some of the dynamics behind inflation to gauge the strength of its underlying current.
A well-known contributing factor to global inflation has been supply chain disruptions. We are therefore keeping a very close eye on the global supply chain pressure index (GSCPI) as it is showing the early signs of a top.
The below chart directly compares US CPI with the GSCPI and, whilst the general trends can agree, there are periods where the two moving in different directions for extended periods. Therefore, we do not view the GSCPI as a predictor of inflation on a month-by-month basis.
However, we think it is fair to assume that the impact of supply chain pressures on inflation has never been higher, which then makes this indicator more relevant for inflationary pressures than it has been previously. Inflation was clearly rising in lockstep with the GSCPI throughout 2021 and we have now seen two back-to-back months where the GSCPI has fallen quite dramatically. At the very least, we could deduce that supply chain pressures will have less of an impact on inflation over the coming months. At best, we could hope that inflation will begin to follow it lower.
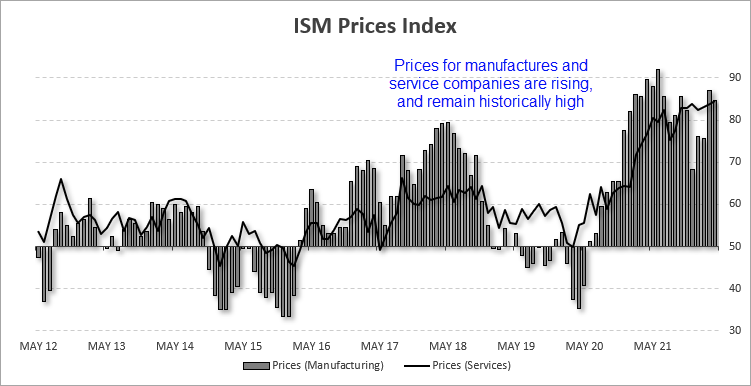
ISM prices continue to show elevated costs for the services and manufacturing sectors
A way to see if the abating pressures are being recognised along the supply chain can be found in the ISM report. And in short, pressures do not seem to be receding that much. Supplier delivery times for manufacturing and services rose in April – meaning delivery times from the supplier were slower across the economy overall. Furthermore, prices paid by manufacturers and services remain historically high and are once rising again.
Consumer inflation expectations show no signs of easing
Consumers also expect prices to continue rising according to the University of Michigan report. Whilst it can be argued that consumer’s may not be the best at forecasting the economy, it could also be argued they plan their spending on their own fears for the future. Currently the 1-year inflation outlook is at a 40-hear high (just like underlying inflation) although consumer confidence is near multi-year lows, which makes it debatable as to whether consumer’s really will bring forward their purchases to beat the incoming inflation. If nothing else this chart shows how alarmed the consumer is, but we’d prefer to pay more attention to ISM prices and the GSCPI to gauge the likelihood that inflation has actually topped.
Inflationary forces may linger for a while longer
Whilst it’s encouraging to see supply chain pressures abating to a degree, there is still a long way to go before we can expect a ‘well-greased’ supply chain to be fully restored. ISM prices remain both elevated and rising, and supplier delivery times remain slow which suggests disruptions across the supply chain could prevail. So even if we do see CPI soften slightly on Wednesday, we’re not yet fully convinced we’ve seen the peak. And that is likely to keep the Fed on the back foot as they chase inflation higher with their measly 50-bps hikes.
WTI considers a break of $100
Of course, we cannot really talk about inflation without mentioning oil. Lockdowns across China have sparked fresh demand concerns and sent oil prices markedly lower yesterday. On one hand lower oil eases up some inflationary pressures but, if the lockdowns persist, supply chains face further disruption.

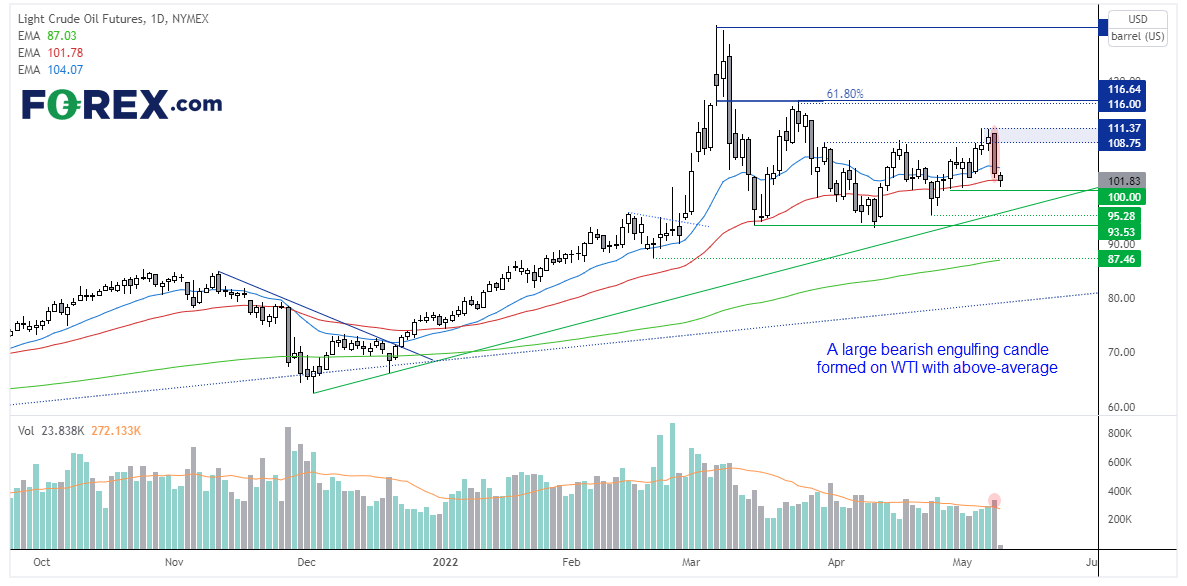
An elongated bearish engulfing candle formed on WTI with above-average volume, so it’s possible we may see the market test $100 whilst demand concerns remain in place. But we remain mindful that the trend is bullish overall, so we suspect any losses from current levels are corrective. And that means oil prices could continue to be a key support for higher consumer costs.
$100 will clearly be a pivotal level this session, a break of which brings the December trendline into focus on the daily chart.
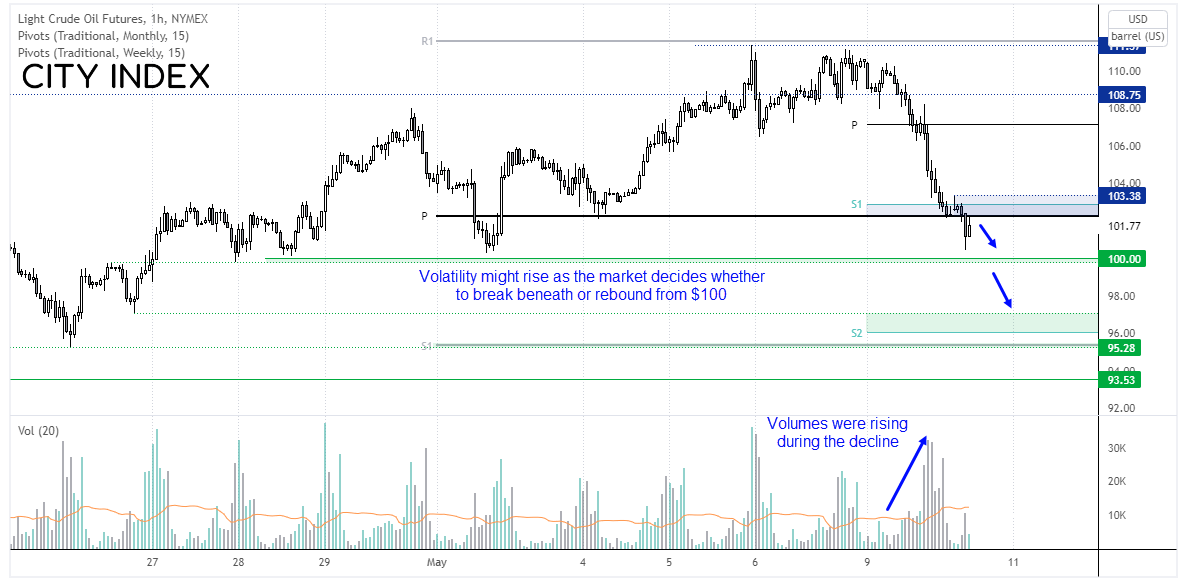

The hourly chart shows a strong bearish move alongside rising volumes. It is yet to test $100 and we suspect there may be some sort of volatile shakeout between $100 - $103 before its next directional move. We think a break beneath $100 is on the cards, where we would then target the $97 support zone, whereas a break above $103.38 assumes a deeper correction is underway on this timeframe.
How to trade with City Index
You can easily trade with City Index by using these four easy steps:
- Open an account, or log in if you’re already a customer
• Open an account in the UK
• Open an account in Australia
• Open an account in Singapore
- Search for the company you want to trade in our award-winning platform
- Choose your position and size, and your stop and limit levels
- Place the trade
Related tags:
Latest market news




The complete CFD trading experience
Award-winning platforms, competitive spreads, low commissions and dedicated support.
We live and breathe the markets and are dedicated to helping traders realise their ambitions as we continue to set the industry bar.
Economic calendar
Web Trader platform
Our sophisticated web-based platform is packed with features.
Related articles
EUR/USD weekly outlook: Oil, inflation and NFP in focus
After coming under significant pressure in recent weeks, the EUR/USD came off its lows to finish the week on a positive note on Friday, albeit with only a mild rebound. That was not enough to prevent the exchange rate falling for the third consecutive week, as the US dollar and bond yields rallied across the board.

Gold Q4 2026 outlook: Resilience in the face of rallying dollar and yields
As we headed towards the latter stages of Q3 and into Q4, the Fed had just hiked rates in a hawkish FOMC meeting, while the likes of the ECB and BoJ had also tightened their respective policies. Oil prices remained elevated amid the prolonged US-Iran conflict. Meanwhile, bond yields were breaking out, and the dollar was higher across the board. Yet, remarkably, gold was still holding in the positive territory for the third quarter, even if it had weakened somewhat in September.

EUR/USD Q4 2026 Outlook: Euro at a Crossroads as Fed, ECB Tighten 9 25 2026
EUR/USD enters Q4 at a pivotal inflection point as competing Fed-ECB policy paths and persistent inflation risks collide with major technical support.
StoneX Europe Ltd may make third party material available on this website which may contain information included but not limited to the conditions of financial markets. The material is for information purposes only and does not contain, and should not be construed as containing, investment advice and/or investment recommendation and/or an investment research and/or an offer of or solicitation for any transactions in financial instruments; any decision to enter into a specific transaction shall be made by the client following an assessment by him/her of their situation.
StoneX Europe Ltd makes no representation or warranty and assumes no liability as to the accuracy or completeness of the information provided, nor any loss arising from any investment based on a recommendation, forecast or other information supplied. You should always seek independent advice as to your suitability to speculate in any related markets and your ability to assume the associated risks, if you are at all unsure. We are not under any obligation to update any such material. Any opinion made may be personal to the author and may not reflect the opinion of StoneX Europe Ltd.