






Canada Ready with the Loaded Double Barrels
With the ammo the Bank of Canada still has left, usd/cad can run up to 1.4682.
Share this:

The Bank of Canada (BOC) did a surprise rate cut of 50 bps on Friday to bring the interest rate to 0.75%. Today, the BOC announced they are ready to adjust policy further and use all available market tools to support growth and keep inflation on target. In addition, Prime Minister Trudeau said that he is planning to bring back the House of Commons to pass emergency measures, in order to get money to their citizens! With the continued demand for the US Dollar, low oil prices, and the continued easing from Canada (with room still to go), the USD/CAD is up over 825 pips since March 6th!
What an amazing move USD/CAD has had since March 6th! On a weekly timeframe, after a false breakdown below the symmetrical triangle, price traded the opposite way and gapped higher on March 9th. Price is now significantly higher on the breakout to the topside. Resistance is at the highs from January 2016 near 1.4682. The RSI is in overbought territory and is diverging, however given the parabolic nature of the move, it should not be used as the sole decision maker for a reversal.
Source: Tradingview, City Index
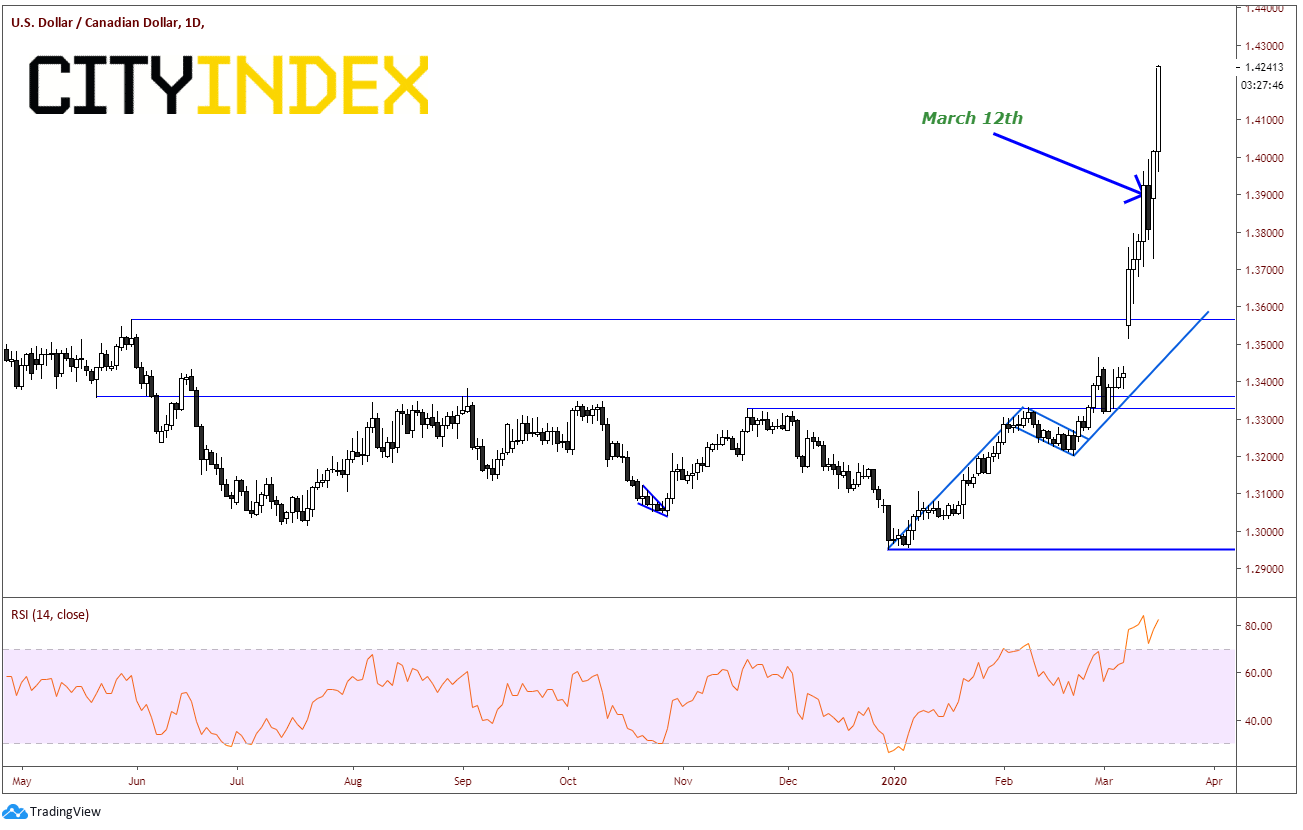
With the amount of room that the BOC still has to cut rates and continued selloff in oil, USD/CAD may continue to move higher! This is a great example of “the RSI is overbought, but in volatile one-way markets such as this, the oscillators don’t matter.” Notice how if someone has solely used the RSI as a decision maker on March 13th, and took a short USD/CAD position when it turned lower from above 80, that person would still be out of the money from that position (without a proper stop).
Source: Tradingview, City Index
On a 240-minute chart, we have a better look at the magnitude of the recent more in USD/CAD:
- January 22nd, the BOC turned dovish in their press conference and the USD/CAD moved from 1.3044 to 1.3152, roughly a 108-pip move.
- March 4th, the BOC was dovish as well, while cutting interest rates from 1.75% to 1.25%. The market moved from 1.3327 to 1.3407, roughly an 80 pip move.
- On March 6th the pair closed at 1.3420. On March 9th, the pair gapped higher to 1.3550 as Saudi Arabi announced that they will increase output to counter Russia’s oil output. Price continued to today’s highs near 1.4245, roughly 825 pips higher.
Source: Tradingview, City Index
As I mentioned earlier, resistance isn’t until 1.4682 on the weekly. There is shorter term support at 1.4017 and 1.4000. Below that, support is the 38.2% retracement from the March 9th low to today’s highs, near 1.3970. Also, the 50% retracement level confluences with the rising trendline near 1.3884.
Source: Tradingview, City Index
Although USD/CAD can pull back, with all the ammo the Bank of Canada still has left, it wouldn’t be unusual for the pair to run up and test the prior highs near 1.4682.
The Bank of Canada (BOC) did a surprise rate cut of 50 bps on Friday to bring the interest rate to 0.75%. Today, the BOC announced they are ready to adjust policy further and use all available market tools to support growth and keep inflation on target. In addition, Prime Minister Trudeau said that he is planning to bring back the House of Commons to pass emergency measures, in order to get money to their citizens! With the continued demand for the US Dollar, low oil prices, and the continued easing from Canada (with room still to go), the USD/CAD is up over 825 pips since March 6th!
What an amazing move USD/CAD has had since March 6th! On a weekly timeframe, after a false breakdown below the symmetrical triangle, price traded the opposite way and gapped higher on March 9th. Price is now significantly higher on the breakout to the topside. Resistance is at the highs from January 2016 near 1.4682. The RSI is in overbought territory and is diverging, however given the parabolic nature of the move, it should not be used as the sole decision maker for a reversal.
Source: Tradingview, FOREX.com
With the amount of room that the BOC still has to cut rates and continued selloff in oil, USD/CAD may continue to move higher! This is a great example of “the RSI is overbought, but in volatile one-way markets such as this, the oscillators don’t matter.” Notice how if someone has solely used the RSI as a decision maker on March 13th, and took a short USD/CAD position when it turned lower from above 80, that person would still be out of the money from that position (without a proper stop).
Source: Tradingview, FOREX.com
On a 240-minute chart, we have a better look at the magnitude of the recent more in USD/CAD:
- January 22nd, the BOC turned dovish in their press conference and the USD/CAD moved from 1.3044 to 1.3152, roughly a 108-pip move.
- March 4th, the BOC was dovish as well, while cutting interest rates from 1.75% to 1.25%. The market moved from 1.3327 to 1.3407, roughly an 80 pip move.
- On March 6th the pair closed at 1.3420. On March 9th, the pair gapped higher to 1.3550 as Saudi Arabi announced that they will increase output to counter Russia’s oil output. Price continued to today’s highs near 1.4245, roughly 825 pips higher.
Source: Tradingview, FOREX.com
As I mentioned earlier, resistance isn’t until 1.4682 on the weekly. There is shorter term support at 1.4017 and 1.4000. Below that, support is the 38.2% retracement from the March 9th low to today’s highs, near 1.3970. Also, the 50% retracement level confluences with the rising trendline near 1.3884.
Source: Tradingview, FOREX.com
Although USD/CAD can pull back, with all the ammo the Bank of Canada still has left, it wouldn’t be unusual for the pair to run up and test the prior highs near 1.4682.
Latest market news




The complete CFD trading experience
Award-winning platforms, competitive spreads, low commissions and dedicated support.
We live and breathe the markets and are dedicated to helping traders realise their ambitions as we continue to set the industry bar.
Economic calendar
Web Trader platform
Our sophisticated web-based platform is packed with features.
Related articles
S&P 500 Forecast: SPX rises as oil prices fall, but treasuries remain at multi-decade highs
U.S. stocks are rising on Friday after a volatile week that saw a surge in Treasury yields ripple through financial markets.

USD/CAD and USD/MXN Q4 2026 Outlook: Will the U.S. Dollar Dominate North America Again?
The final stretch of 2026 is approaching, and North America's major currencies have begun to show a shift in the strength dynamics seen earlier in the year. New expectations of a more aggressive monetary policy stance, particularly in the United States, could be significantly reshaping the outlook for the region. At the same time, this backdrop, combined with potential trade tensions across North America, may become one of the most important drivers of currency performance in the months ahead.

Oil Quietly Hands the Fed a Reason to Stay Hawkish
Oil prices and the U.S. dollar are both on the front foot as elevated energy costs feed Fed warnings that inflation may prove sticky.

StoneX Europe Ltd may make third party material available on this website which may contain information included but not limited to the conditions of financial markets. The material is for information purposes only and does not contain, and should not be construed as containing, investment advice and/or investment recommendation and/or an investment research and/or an offer of or solicitation for any transactions in financial instruments; any decision to enter into a specific transaction shall be made by the client following an assessment by him/her of their situation.
StoneX Europe Ltd makes no representation or warranty and assumes no liability as to the accuracy or completeness of the information provided, nor any loss arising from any investment based on a recommendation, forecast or other information supplied. You should always seek independent advice as to your suitability to speculate in any related markets and your ability to assume the associated risks, if you are at all unsure. We are not under any obligation to update any such material. Any opinion made may be personal to the author and may not reflect the opinion of StoneX Europe Ltd.