



CPI Preview: Is inflation close to peaking?
After a surge to 7% YoY for December, CPI is expected to have increase to 7.3% YoY in January.
Share this:

The US releases CPI on Thursday morning. After a surge to 7% YoY for December, CPI is expected to have increase to 7.3% YoY in January. In addition, the January Core CPI, which excludes food and energy, is expected to increase to 5.9% from 5.5% last. Remember that the Fed targets 2% inflation!
Indeed, this will be an important data print for the Fed. Recall that Fed Chairman Powell said during his press conference after the last FOMC meeting that in his view, inflation risks are still to the upside and that inflation could be higher for longer than expected. In addition, he noted that we are not making progress on the supply chain issue. He also said the “committee is of a mind to raise rates at the March meeting.” The main issue markets are focusing on now is : Will it be a 25bps hike or a 50bps hike? Markets are also wondering how soon the Fed will begin unwinding its bond holdings after the first hike. If the print is higher than expected, this may happen sooner than later.
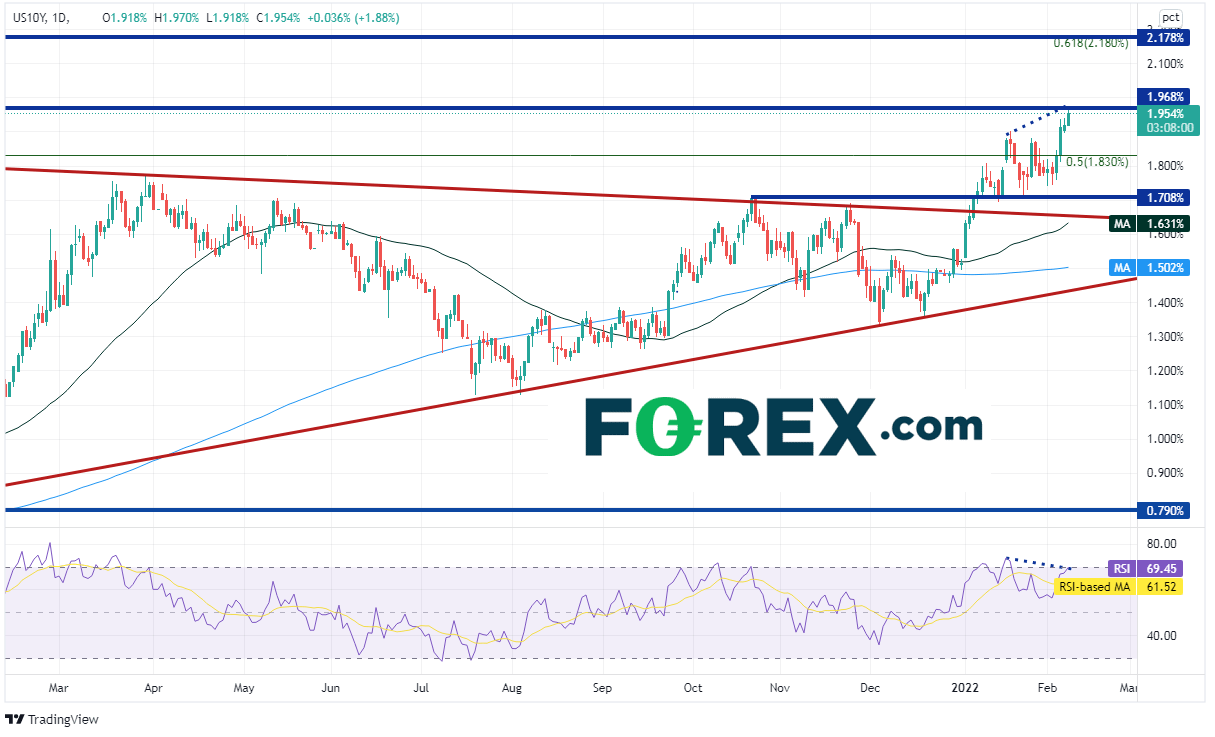
On concerns of rising interest rates, bond yields are moving higher. The benchmark 10-year yield traded as high as 1.97% on Tuesday, its highest level since July 2019 and just a few basis points below the psychological round number 2% level. Notice that the RSI is diverging from yields, a possible indication that they may pullback a bit before resuming the larger trend higher.
Source: Tradingview, Stone X
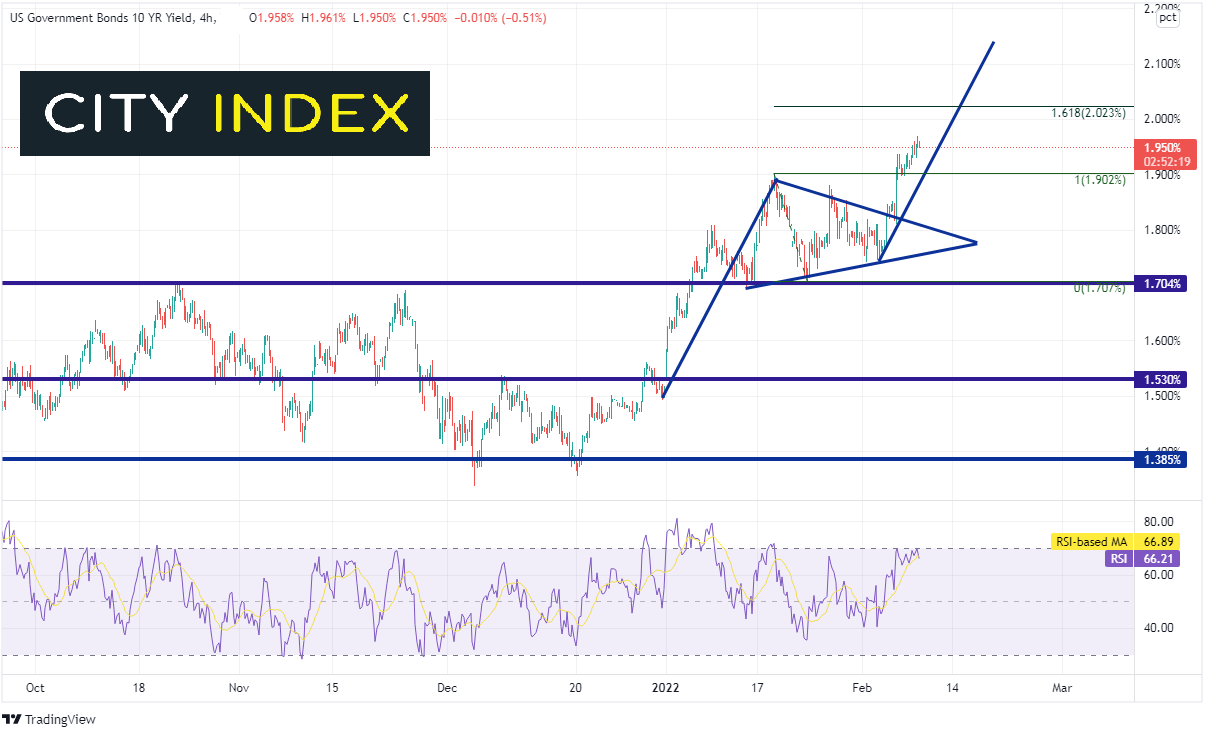
On a 240-minute timeframe, 10-year yields have been moving higher after breaking out of a pennant formation on February 3rd. The target for the pennant is the length of the pennant “pole” added to the breakout point. In this case the target is near 2.14%. However, for it to get there, yields must first pass through the psychological round number resistance level of 2% and then the 161.8% Fibonacci extension from the high of January 19th to the low on January 24th, near 2.023%. First support is at the high of January 19th near 1.902%. Below there is a confluence of support at the near the apex of the pennant between 1.743% and 1.80%, and then the January 19th low at 1.694%.

Source: Tradingview, Stone X
If inflation comes out as expected on Thursday at 7.3%, it will be the highest level since February 1982! However, traders will still be searching as to when the peak will be made for CPI. Will US yields continue higher? Or will the Fed start raising rates, possibly even by 50bps in March in order to stem the rise? Thursday’s CPI result may give traders a clue.
The US releases CPI on Thursday morning. After a surge to 7% YoY for December, CPI is expected to have increase to 7.3% YoY in January. In addition, the January Core CPI, which excludes food and energy, is expected to increase to 5.9% from 5.5% last. Remember that the Fed targets 2% inflation!
Indeed, this will be an important data print for the Fed. Recall that Fed Chairman Powell said during his press conference after the last FOMC meeting that in his view, inflation risks are still to the upside and that inflation could be higher for longer than expected. In addition, he noted that we are not making progress on the supply chain issue. He also said the “committee is of a mind to raise rates at the March meeting.” The main issue markets are focusing on now is : Will it be a 25bps hike or a 50bps hike? Markets are also wondering how soon the Fed will begin unwinding its bond holdings after the first hike. If the print is higher than expected, this may happen sooner than later.
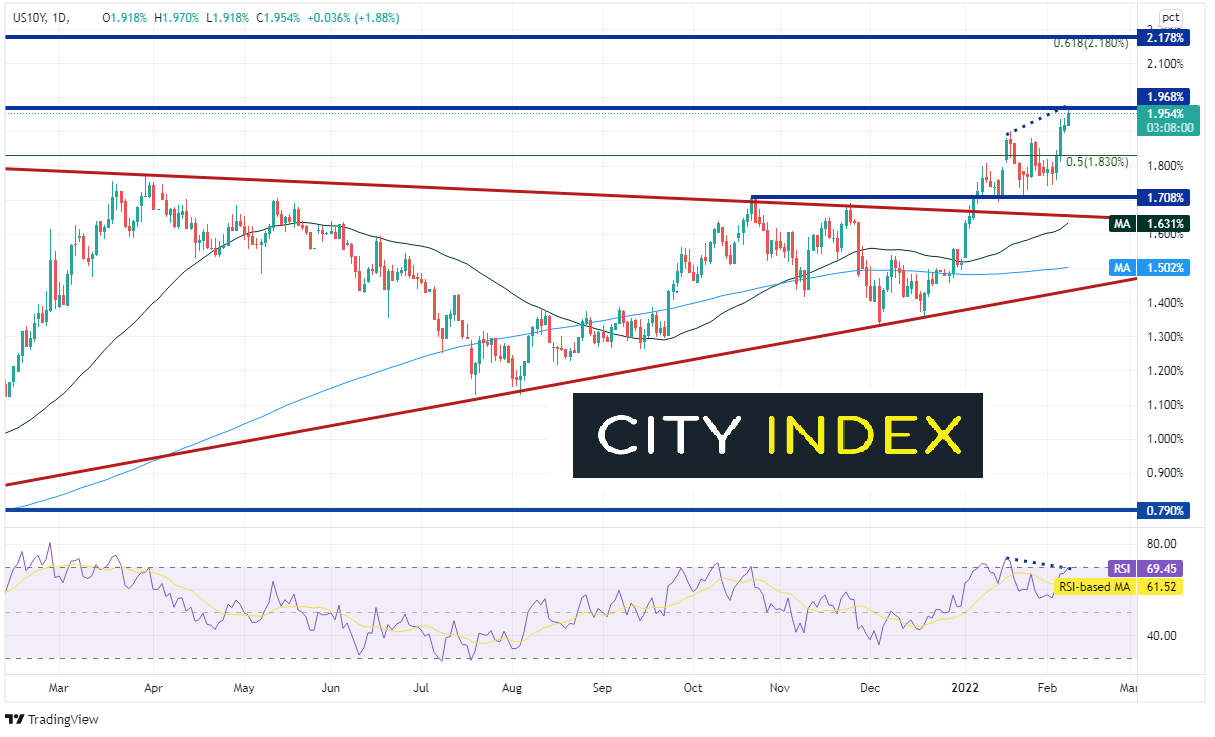
On concerns of rising interest rates, bond yields are moving higher. The benchmark 10-year yield traded as high as 1.97% on Tuesday, its highest level since July 2019 and just a few basis points below the psychological round number 2% level. Notice that the RSI is diverging from yields, a possible indication that they may pullback a bit before resuming the larger trend higher.
Source: Tradingview, Stone X
On a 240-minute timeframe, 10-year yields have been moving higher after breaking out of a pennant formation on February 3rd. The target for the pennant is the length of the pennant “pole” added to the breakout point. In this case the target is near 2.14%. However, for it to get there, yields must first pass through the psychological round number resistance level of 2% and then the 161.8% Fibonacci extension from the high of January 19th to the low on January 24th, near 2.023%. First support is at the high of January 19th near 1.902%. Below there is a confluence of support at the near the apex of the pennant between 1.743% and 1.80%, and then the January 19th low at 1.694%.
Source: Tradingview, Stone X
If inflation comes out as expected on Thursday at 7.3%, it will be the highest level since February 1982! However, traders will still be searching as to when the peak will be made for CPI. Will US yields continue higher? Or will the Fed start raising rates, possibly even by 50bps in March in order to stem the rise? Thursday’s CPI result may give traders a clue.


The complete CFD trading experience
Award-winning platforms, competitive spreads, low commissions and dedicated support.
We live and breathe the markets and are dedicated to helping traders realise their ambitions as we continue to set the industry bar.
Economic calendar
Web Trader platform
Our sophisticated web-based platform is packed with features.
Related articles
Japanese Yen Forecast: USD/JPY 4% Rally Challenges Post-Intervention Downtrend 9 24 2026
USD/JPY momentum has shifted sharply higher, putting a major resistance confluence in focus as U.S. and Japanese event risk builds.

Oil Quietly Hands the Fed a Reason to Stay Hawkish
Oil prices and the U.S. dollar are both on the front foot as elevated energy costs feed Fed warnings that inflation may prove sticky.


USD/JPY outlook: Hawkish Fed recalibration pressures the yen
Stronger US growth momentum and rising Treasury yields are keeping USD/JPY pointed higher, even as Japanese policymakers try to limit the pressure building across domestic markets.

StoneX Europe Ltd may make third party material available on this website which may contain information included but not limited to the conditions of financial markets. The material is for information purposes only and does not contain, and should not be construed as containing, investment advice and/or investment recommendation and/or an investment research and/or an offer of or solicitation for any transactions in financial instruments; any decision to enter into a specific transaction shall be made by the client following an assessment by him/her of their situation.
StoneX Europe Ltd makes no representation or warranty and assumes no liability as to the accuracy or completeness of the information provided, nor any loss arising from any investment based on a recommendation, forecast or other information supplied. You should always seek independent advice as to your suitability to speculate in any related markets and your ability to assume the associated risks, if you are at all unsure. We are not under any obligation to update any such material. Any opinion made may be personal to the author and may not reflect the opinion of StoneX Europe Ltd.