





Dax forecast: A closer look at Santa’s rally for the DAX
Like the vast majority of indices, the Dax has generally performed well in December. But a closer look at December's performance shows a strong tendency to rally either side of Christmas.
Share this:

Like the vast majority of indices, the Dax has generally performed well in December. Looking back through data since 1987, the DAX has closed higher 71.4% of the time with an average positive return of 2.2%. I’s best streak was to post gains in December for eight consecutive years between 2003 to 2010, although this relationship seems to have faltered in recent years, with three of the past six December posting a loss.
The DAX reached a record high this month and seems on track to close December as another positive month, but will it have enough juice in its tank to rally into the year end? Given we have seen prices retrace from its record high ye6 hold above support, I suspect it can.
Dax seasonality by month
Dax seasonality in December
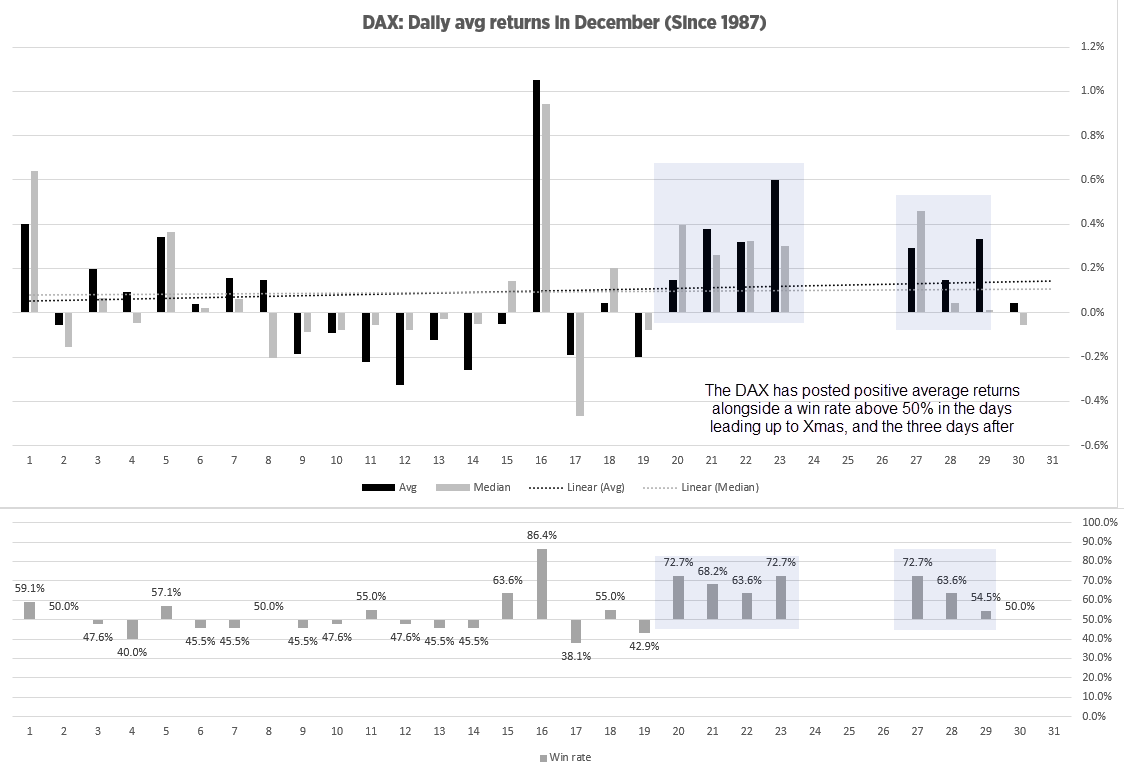
The following chart shows average and median returns for the Dax by calendar day, using daily data since 1987. The win rate is also displayed below, as what I like to see is the combination of positive returns alongside a positive win rate. It is interesting to note that the DAX has delivered positive average and median returns alongside a positive win rate on the 20th through to the 23rd of December, and on the three days it has opened after Christmas ahead of the New Year. Also note that the 19th (today) has posted negative median and average returns alongside a lose rate of 57.1%.
Dax technical analysis (daily chart):
If the Dax is to follow it’s seasonal pattern from here, we could assume a down day today and look for evidence of a swing low after the close. The previous record high (now the July high) is one area to look for potential support, ahead of an anticipated rally into Christmas and the three working days after Christmas, ahead of the new year.
Note that a shooting star reversal formed on the weekly chart after it reached a record high. A bearish engulfing day formed on high volume and negative delta (more sellers than buyers) to show bears loaded up at these highs. So if prices fail to drop materially from here, bears may be forced to cover and help generate a rally.
Traders should be aware that seasonal analysis really does just look at average historic performance and is not simply a roadmap for future directional prices. But it can be used to complement one’s own research.
-- Written by Matt Simpson
Follow Matt on Twitter @cLeverEdge
How to trade with City Index
You can trade with City Index by following these four easy steps:
- Open an account, or log in if you’re already a customer
• Open an account in the UK
• Open an account in Australia
• Open an account in Singapore
- Search for the market you want to trade in our award-winning platform
- Choose your position and size, and your stop and limit levels
- Place the trade
Related tags:



The complete CFD trading experience
Award-winning platforms, competitive spreads, low commissions and dedicated support.
We live and breathe the markets and are dedicated to helping traders realise their ambitions as we continue to set the industry bar.
Economic calendar
Web Trader platform
Our sophisticated web-based platform is packed with features.
Related articles

AUD/USD forecast: Currency Pair of the Week | September 28, 2026
The week has started with stocks, gold, silver and bitcoin all falling, as crude oil rebounded and bond yields pushed further higher. Trump refusing to agree to Tehran’s proposal to re-open the Strait of Hormuz has left the markets disappointed. Still, reports that mediators are expected to hold talks with the two sides on an amended version of the 7-day proposal that Iran presented, keeps hopes alive that we may see some progress.


Gold Outlook: XAU/USD hit hard as US yields, dollar resume ascent
A stronger dollar, surging front-end yields and renewed geopolitical tension have combined to push gold back towards key technical support.


EUR/USD weekly outlook: Oil, inflation and NFP in focus
After coming under significant pressure in recent weeks, the EUR/USD came off its lows to finish the week on a positive note on Friday, albeit with only a mild rebound. That was not enough to prevent the exchange rate falling for the third consecutive week, as the US dollar and bond yields rallied across the board.
StoneX Europe Ltd may make third party material available on this website which may contain information included but not limited to the conditions of financial markets. The material is for information purposes only and does not contain, and should not be construed as containing, investment advice and/or investment recommendation and/or an investment research and/or an offer of or solicitation for any transactions in financial instruments; any decision to enter into a specific transaction shall be made by the client following an assessment by him/her of their situation.
StoneX Europe Ltd makes no representation or warranty and assumes no liability as to the accuracy or completeness of the information provided, nor any loss arising from any investment based on a recommendation, forecast or other information supplied. You should always seek independent advice as to your suitability to speculate in any related markets and your ability to assume the associated risks, if you are at all unsure. We are not under any obligation to update any such material. Any opinion made may be personal to the author and may not reflect the opinion of StoneX Europe Ltd.