







DAX Potential bearish breakdown below 12900 on Middle East tensions
DAX bears claws are getting ready to strike, watch 12900.
Share this:

Medium-term technical outlook on DAX (Germany 30)
click to enlarge charts
This analysis is an update to our earlier weekly stock indices outlook report published on Mon, 06 Jan (click here for a recap).
Key Levels (1 to 3 weeks)
Intermediate resistance: 13150
Pivot (key resistance): 13450
Supports: 12900, 12790 & 12600/500
Next resistances: 13600/750 & 14115
Directional Bias (1 to 3 weeks)
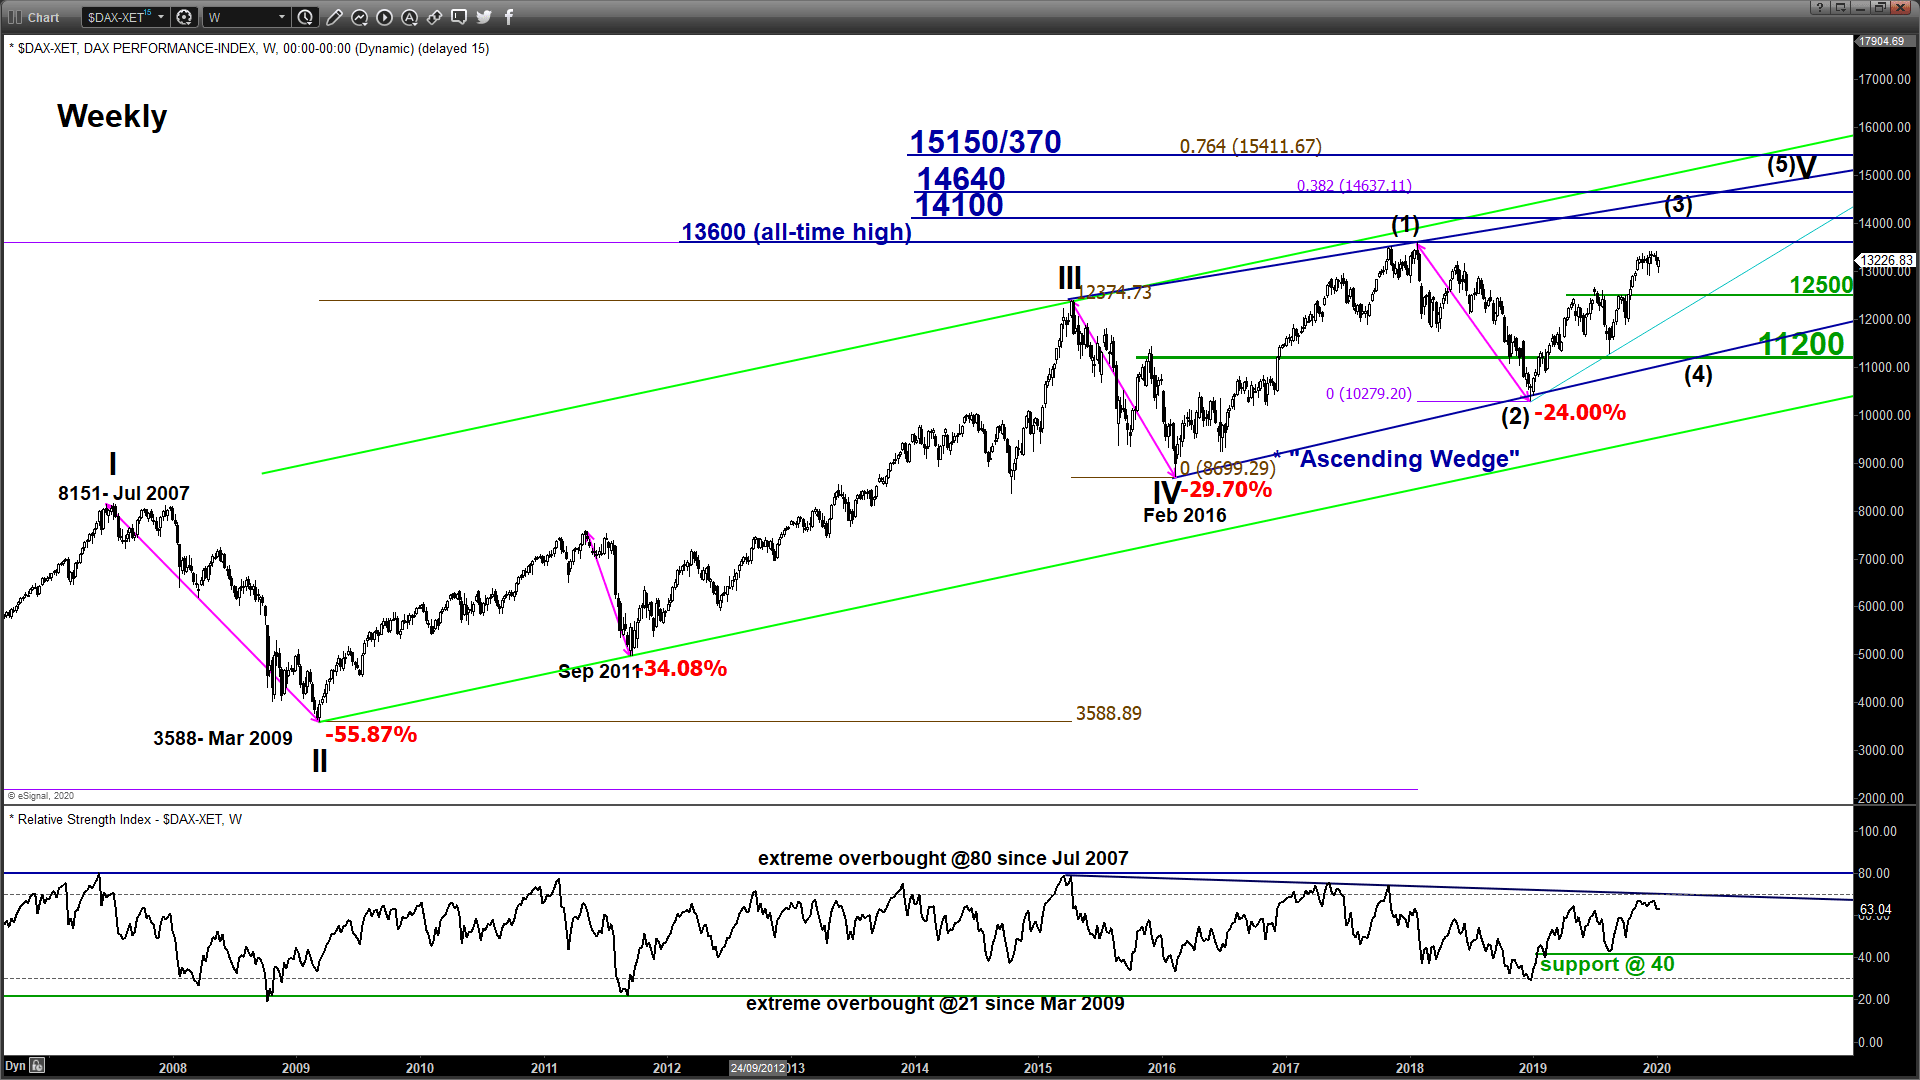
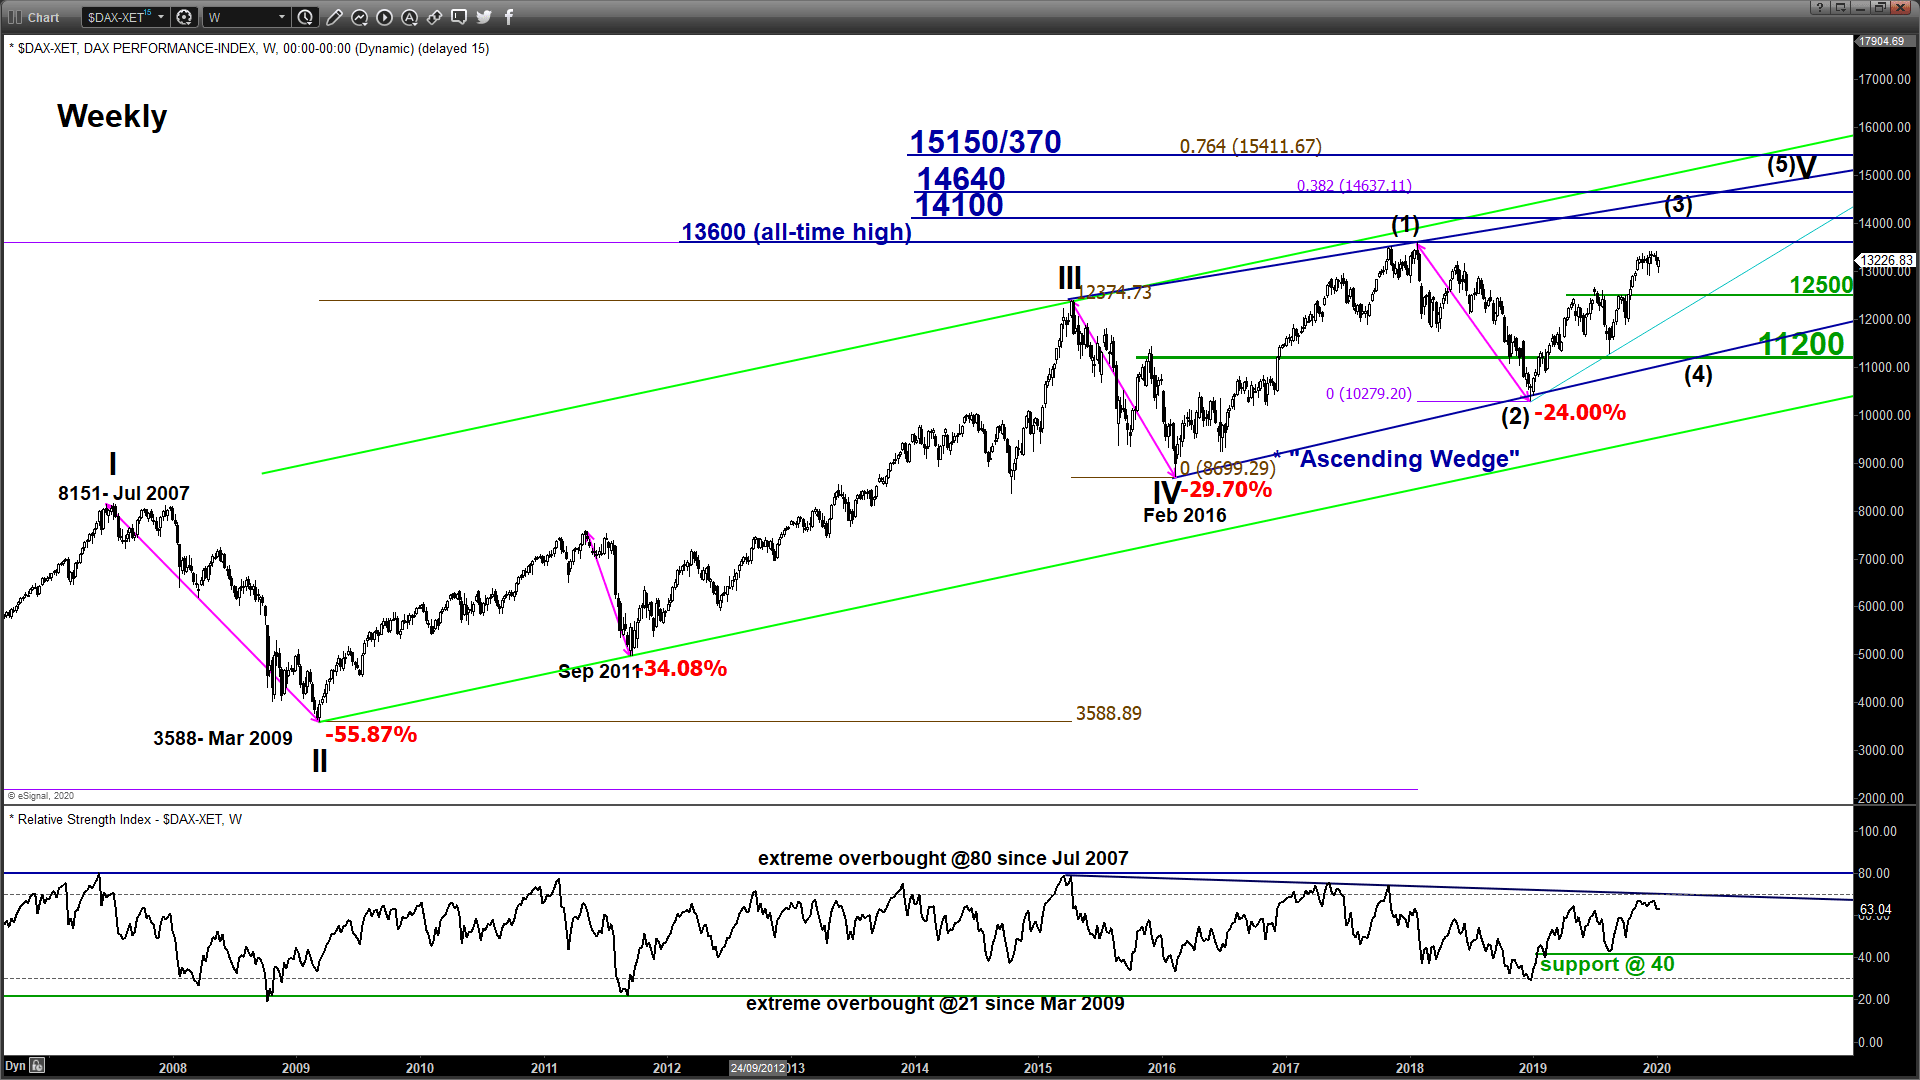
Key elements of the Germany 30 Index (proxy for the DAX futures) are now advocating for potential bearish breakdown below a 4-week old range configuration in place since 19 Nov 2019. Flip to a bearish bias below 13450 key medium-term pivotal resistance and a break below 12900 reinforces a potential corrective down move sequence within a major uptrend phase to target the next supports at 12790 and 12600/500 next.
On the flipside, a clearance above 13450 invalidates the bearish tone for a probe on the current all-time all high area of 13600/750. Only a daily close above 13750 opens up scope for a more pronounced rally to target the next resistance at 14115 (Fibonacci expansion cluster).
Key elements
- Since its swing high of 19 Nov 2019, the price action of the Index has traced out a medium-term bearish reversal “Double Top” configuration with its neckline support at 12900 and potential bearish breakout exit target at 12600 that confluences with the former swing high areas of 13 Sep/22 Sep/01 Oct 2019.
- The daily RSI oscillator is now looking vulnerable to the downside as it is testing a key corresponding support at 45 level the 3rd time with a prior bearish divergence signal. These observations suggest medium-term downside momentum of price action is building up.
- The 12600/500 medium-term support is also defined by a Fibonacci cluster (38.2% retracement of the prior multi-month up move from 15 Aug 2019 low to 02 Jan 2020 low & 1.618 expansion of the latest slide from 03 Jan 2020 high to 06 Jan 2020 low projected from 07 Jan 2020 high.
Charts are from City Index Advantage TraderPro & eSignal
Medium-term technical outlook on DAX (Germany 30)
click to enlarge charts
This analysis is an update to our earlier weekly stock indices outlook report published on Mon, 06 Jan (click here for a recap).
Key Levels (1 to 3 weeks)
Intermediate resistance: 13150
Pivot (key resistance): 13450
Supports: 12900, 12790 & 12600/500
Next resistances: 13600/750 & 14115
Directional Bias (1 to 3 weeks)
Key elements of the Germany 30 Index (proxy for the DAX futures) are now advocating for potential bearish breakdown below a 4-week old range configuration in place since 19 Nov 2019. Flip to a bearish bias below 13450 key medium-term pivotal resistance and a break below 12900 reinforces a potential corrective down move sequence within a major uptrend phase to target the next supports at 12790 and 12600/500 next.
On the flipside, a clearance above 13450 invalidates the bearish tone for a probe on the current all-time all high area of 13600/750. Only a daily close above 13750 opens up scope for a more pronounced rally to target the next resistance at 14115 (Fibonacci expansion cluster).
Key elements
- Since its swing high of 19 Nov 2019, the price action of the Index has traced out a medium-term bearish reversal “Double Top” configuration with its neckline support at 12900 and potential bearish breakout exit target at 12600 that confluences with the former swing high areas of 13 Sep/22 Sep/01 Oct 2019.
- The daily RSI oscillator is now looking vulnerable to the downside as it is testing a key corresponding support at 45 level the 3rd time with a prior bearish divergence signal. These observations suggest medium-term downside momentum of price action is building up.
- The 12600/500 medium-term support is also defined by a Fibonacci cluster (38.2% retracement of the prior multi-month up move from 15 Aug 2019 low to 02 Jan 2020 low & 1.618 expansion of the latest slide from 03 Jan 2020 high to 06 Jan 2020 low projected from 07 Jan 2020 high.
Charts are from City Index Advantage TraderPro & eSignal
Related tags:
Latest market news




The complete CFD trading experience
Award-winning platforms, competitive spreads, low commissions and dedicated support.
We live and breathe the markets and are dedicated to helping traders realise their ambitions as we continue to set the industry bar.
Economic calendar
Web Trader platform
Our sophisticated web-based platform is packed with features.
Related articles

S&P 500 forecast: Stocks extend drop as correction risks grow
US and global equity markets have extended Wednesday’s sell-off, with Wall Street opening lower after a weak handover from Asia and Europe. The deterioration in risk appetite has been spreading across global markets. The dollar was firmer, Treasury yields were holding onto yesterday’s gains, while gold, silver and bitcoin were all under pressure alongside equities and major currencies.


Nikkei threatens breakout as tech rebound broadens
Breakouts across the SOX and Nasdaq are being matched by rebounds across Asia, with the Nikkei now threatening to join the move.


Nasdaq 100 Forecast: Confidence Returns as the Index Challenges Record Highs
The trading week is getting underway with renewed bullish momentum across Nasdaq. This is reflected in today's session, where the index has gained more than 2.5%, highlighting a buying bias that has not been observed with this level of strength in several weeks.

StoneX Europe Ltd may make third party material available on this website which may contain information included but not limited to the conditions of financial markets. The material is for information purposes only and does not contain, and should not be construed as containing, investment advice and/or investment recommendation and/or an investment research and/or an offer of or solicitation for any transactions in financial instruments; any decision to enter into a specific transaction shall be made by the client following an assessment by him/her of their situation.
StoneX Europe Ltd makes no representation or warranty and assumes no liability as to the accuracy or completeness of the information provided, nor any loss arising from any investment based on a recommendation, forecast or other information supplied. You should always seek independent advice as to your suitability to speculate in any related markets and your ability to assume the associated risks, if you are at all unsure. We are not under any obligation to update any such material. Any opinion made may be personal to the author and may not reflect the opinion of StoneX Europe Ltd.