




Dell & HP Q3 2024 Earnings Preview: Key Insights & Risks
Dell & HP Inc. Q3 2024 Earnings Preview: Growth vs. Challenges Dell Technologies (DELL) and HP Inc. (HPQ) are set to release their Q3 2024 earnings aftermarket today. Both companies show growth potential but face unique challenges amid PC market headwinds.
Share this:

Dell (DELL) Q3 2024 Earnings Preview
Earnings Release Date: November 26, 2024 (Aftermarket)
Consensus EPS: $2.07 (+9% YoY)
Expected Revenue: $24.59 billion (+10.3% YoY)
Positives:
- Consistent Earnings Outperformance: Dell has consistently beaten EPS estimates, with last quarter’s EPS of $1.89 exceeding expectations by 8.62%.
- Net Margin Growth: Dell’s net margin improved by 115%, increasing from 2% to 4.3%, reflecting better profitability and cost control.
- Share Buybacks: The company reduced shares outstanding by 3%, which has supported EPS growth and returned value to shareholders.
- Strong YTD Performance: Dell is up 88% year-to-date, far outpacing the S&P 500’s 25.96% rise. Dell was also reintroduced to the S&P 500 in September 2024 after a decade-long absence, signaling market confidence in its trajectory.
Negatives:
- Insider Selling: Insiders sold $1.7 billion worth of shares over the last three months, raising concerns about confidence in future performance.
- Declining Consumer Revenue: Weak PC shipments and flat commercial client revenues highlight challenges in demand across key segments.
- Market Pressures: Dell reported the largest decline in global PC shipments in Q3 2024, down 3-9% YoY, reflecting competitive pressures and consumer demand challenges.
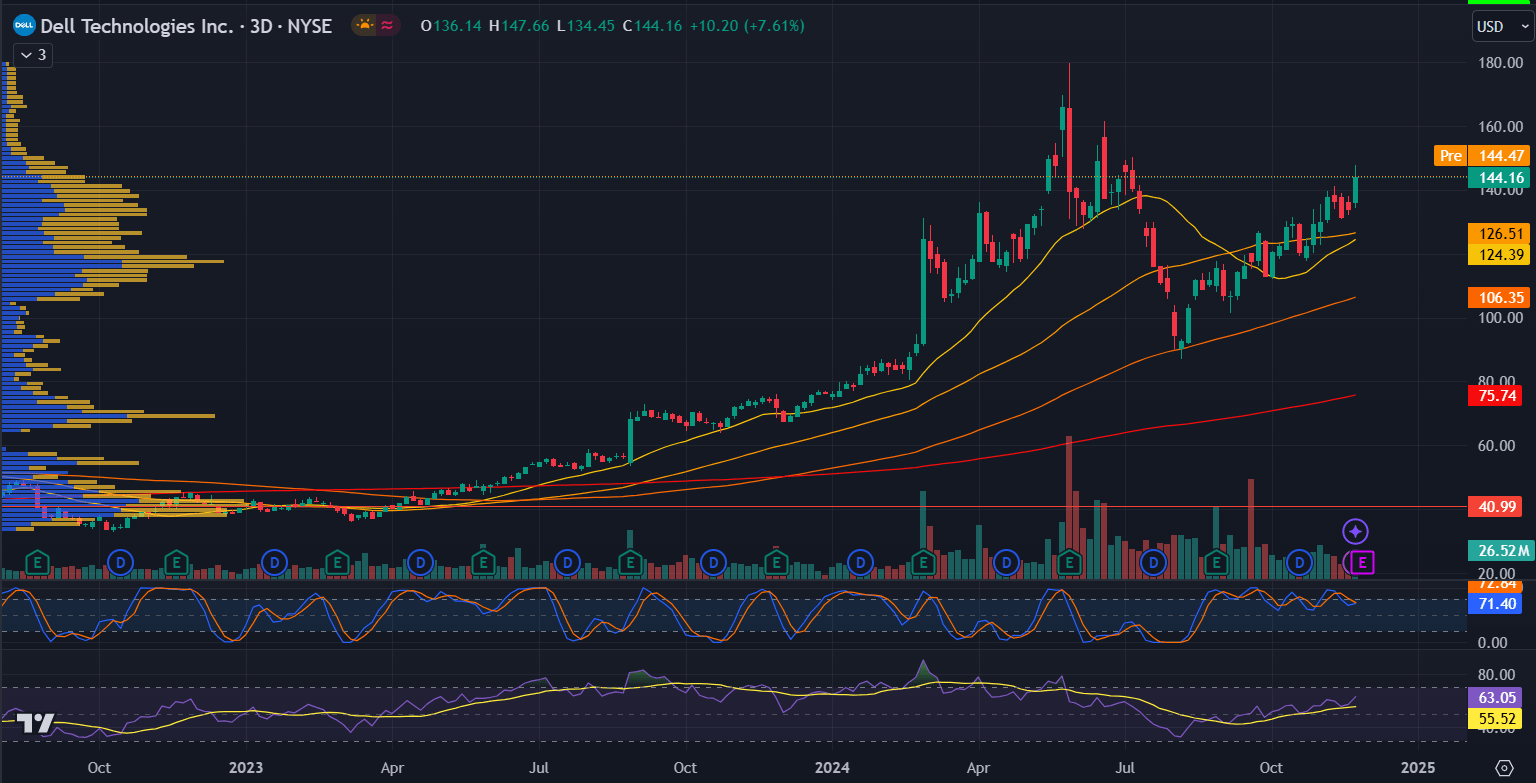
Dell Technologies Inc. (DELL) Technical Analysis 3 Day
1. Current Price Action and Trend:
- Dell is trading at $144.16, reflecting a significant bullish breakout with a 7.61% gain.
- The stock has reclaimed a critical resistance level near $144, signaling strong buying interest and potential for continued upward movement.
- Dell has broken out of a consolidation pattern and is trending higher, with strong volume supporting the breakout.
- The stock is approaching a critical resistance zone near $147.66, which will determine the sustainability of the rally.
2. Support and Resistance Levels:
- Resistance:
- The immediate resistance is at $147.66, which aligns with recent highs. A breakout above this level could lead to a retest of previous peaks near $160.
- Beyond $160, the next psychological resistance would be $170, aligning with long-term projections.
- Support:
- The nearest support is at $126.51 (aligned with the EMA 50), which has previously acted as a consolidation zone.
- Further support lies at $124.39 (EMA 100) and $106.35, which represent stronger bases for downside protection.
3. Moving Averages:
- Dell is trading well above all key moving averages:
4. RSI and Stochastic RSI:
- The RSI is at 63.05, indicating bullish momentum but not yet in overbought territory. This suggests room for further upside.
- The Stochastic RSI is at 71.40, nearing overbought conditions. While this indicates strong momentum, it also suggests caution as a short-term pullback or consolidation could occur.
5. Volume Profile:
- Significant volume is concentrated between $100–$126, suggesting strong institutional interest and a solid base of support.
- The recent breakout is accompanied by increased volume, confirming the validity of the bullish move.
Conclusion:
Dell’s strong revenue growth and profitability improvements are positives, but challenges in its consumer segment and significant insider selling warrant caution. Investors should focus on whether Dell can continue to outperform expectations despite broader PC market weakness.
HP Inc. (HPQ) Q3 2024 Earnings Preview
Earnings Release Date: November 26, 2024 (Aftermarket)
Consensus EPS: $0.94 (+3.3% YoY)
Expected Revenue: $13.96 billion (+1% YoY)
Positives:
- Strong AI Momentum: HP’s OmniBook Ultra has positioned the company as a leader in AI-powered PCs, likely boosting Personal Systems revenue.
- Stock Buyback Program: HP’s plan to repurchase up to $10 billion in shares reflects management’s belief that the stock is undervalued.
- Revenue Growth: HP reported a 2.4% YoY revenue increase last quarter, showing resilience in challenging conditions.
- Diverse Product Offerings: HP’s broad portfolio enables it to capture evolving market demands, particularly in sectors benefiting from AI integration.
Negatives:
- Weakness in the Printing Division: Losses in the printing segment are expected to offset gains in Personal Systems, potentially dampening overall performance.
- Low Insider Ownership: With only 0.41% insider ownership, alignment between management and shareholders may be limited.
- Return on Equity (ROE): HP’s negative ROE of -266.37% raises concerns about its financial efficiency and profitability.
- Mixed Analyst Sentiment: Downgrades and cautious ratings from analysts suggest market skepticism about HP’s near-term outlook.
HP Inc. (HPQ) 3-day technical analysis:
1. Current Price Action and Trend:
- HPQ is trading at $34.50, reflecting a modest gain of +0.82% as it approaches a critical resistance level near $35.00–$36.14.
- The stock is trending higher, supported by key moving averages that suggest a strengthening bullish outlook.
2. Support and Resistance Levels:
- Resistance:
- Immediate resistance lies at $36.14, a level near recent highs. A breakout above this zone could lead to a bullish continuation.
- The next major resistance is at $39.40, representing a significant upper range from past price action.
- Support:
- Immediate support is found at $35.00 (EMA 20), which aligns with recent consolidation levels.
- Further support levels include $31.81 (EMA 50) and $30.69, offering strong downside protection.
- The $29.86 level represents the 200-day moving average, providing long-term support.
3. Moving Averages:
- The stock is trading above all key moving averages and all are trending upward, reinforcing bullish momentum. The 200-day moving average at $29.86 is far below the current price, reflecting a strong long-term trend.
4. RSI and Stochastic RSI:
- The RSI is at 63.78, signaling bullish momentum but not yet overbought, leaving room for further upside.
- The Stochastic RSI is at 46.81, trending higher but still in neutral territory, suggesting the potential for continued upward movement.
5. Volume Profile:
- A significant volume cluster between $30–$35 indicates strong institutional support and buying interest at these levels.
- The recent uptick in price is accompanied by above-average volume, confirming the validity of the bullish breakout.
6. Key Observations:
- HPQ is nearing a critical breakout point near $36.14, a level it has struggled to breach in the past.
- The stock is showing a pattern of higher highs and higher lows, consistent with a bullish trend.
Conclusion:
HP’s investment in AI and its aggressive share repurchase program highlight its strategic focus on growth and shareholder value. However, weaknesses in the printing division and low insider alignment pose risks. Investors should assess whether strength in AI PCs and Personal Systems can offset these challenges.
Investor Takeaway:
- Dell offers better growth metrics and profitability, but significant insider selling and PC market weakness may weigh on performance.
- HP is leveraging AI momentum and stock buybacks but faces challenges in the printing division and limited insider alignment.
Both companies present growth opportunities, but sector-specific headwinds warrant a cautious approach.
Related tags:



The complete CFD trading experience
Award-winning platforms, competitive spreads, low commissions and dedicated support.
We live and breathe the markets and are dedicated to helping traders realise their ambitions as we continue to set the industry bar.
Economic calendar
Web Trader platform
Our sophisticated web-based platform is packed with features.
Related articles

S&P 500 Forecast: SPX Continues to Drift Away from Record Highs
Recent trading sessions have done little to restore confidence in the equity market. Over the last four sessions, the S&P 500 has declined by nearly 1.00%, a move that highlights growing short-term weakness and keeps the index moving further away from its record-high territory.


Nasdaq Breakout Potential into Q4 for Melt Up Scenarios
The headlines seem negative in almost any place that you look, with surging Treasury yields and frothy AI valuations getting more and more attention. But, if it’s so bad, why hasn’t the Nasdaq melted down yet, even as the Fed has started hiking rates?


Nikkei threatens breakout as tech rebound broadens
Breakouts across the SOX and Nasdaq are being matched by rebounds across Asia, with the Nikkei now threatening to join the move.

StoneX Europe Ltd may make third party material available on this website which may contain information included but not limited to the conditions of financial markets. The material is for information purposes only and does not contain, and should not be construed as containing, investment advice and/or investment recommendation and/or an investment research and/or an offer of or solicitation for any transactions in financial instruments; any decision to enter into a specific transaction shall be made by the client following an assessment by him/her of their situation.
StoneX Europe Ltd makes no representation or warranty and assumes no liability as to the accuracy or completeness of the information provided, nor any loss arising from any investment based on a recommendation, forecast or other information supplied. You should always seek independent advice as to your suitability to speculate in any related markets and your ability to assume the associated risks, if you are at all unsure. We are not under any obligation to update any such material. Any opinion made may be personal to the author and may not reflect the opinion of StoneX Europe Ltd.