



EUR/USD outlook: Where to next?
The EUR/USD outlook remains positive as sings of disinflation has fueled optimism over peak interest rates with one final Fed hike likely come July 26.
Share this:

The EUR/USD outlook remained positive as it probed the 1.12 handle, with the dollar continuing to fall for the sixth consecutive day against a basket of foreign currencies. The Dollar Index, meanwhile, was testing 100.00. Investors grew further convinced that July will mark the end of the rate-hiking cycle by the Fed, after the latest inflation data pointed to weakening price pressures.
More on the inflation data below, but first let’s quickly take a look at the EUR/USD’s chart…
EUR/USD outlook: Technical analysis
 Source: TradingView.com
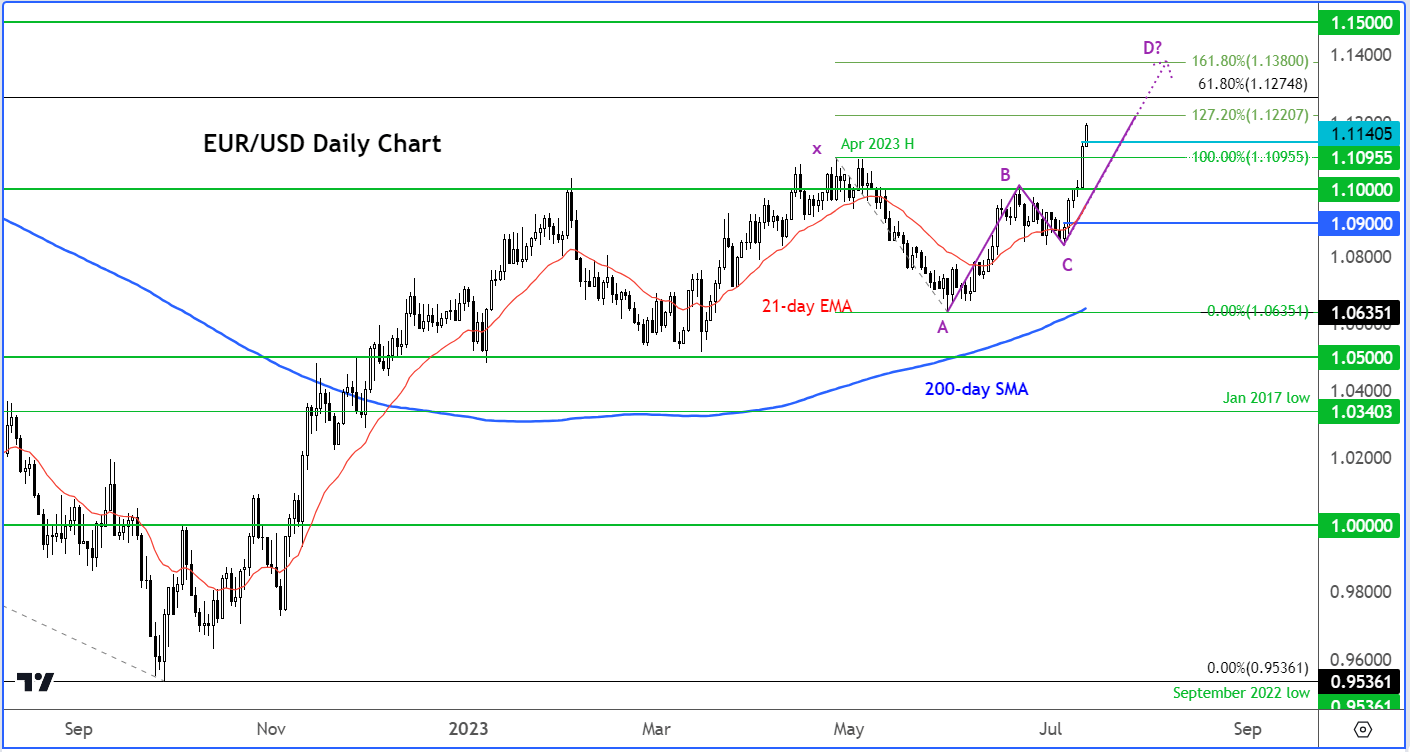
The explosive breakout we have seen over the past couple of days suggests the EUR/USD bulls will likely remain in control of price action for a while yet, especially as the long-term trend is also bullish – look no further than the slope of the 200-day moving average.
Interestingly, there’s a Fibonacci-based price action in the making, namely a hormonic Butterfly – see the annotation on the chart. With price points X, A, B and C already established, the key question is where will point “D” occur. This is usually where price finds resistance and turns lows. Fibonacci extension levels can be our guide. The 127.2% extension of the BC leg comes in at 1.1220. But given the sharper move in this CD leg compared to the AB wave, I would expect the CD leg to be bigger than the AB leg. Thus, a continuation towards the 161.8% Fibonacci extension level at 1.1380 is where I would be looking for the EUR/USD to potentially form at least a temporary top.
Meanwhile, the long-term 61.8% Fibonacci retracement level against the drop from the 2021 high comes in at 1.1275.
In terms of support, Wednesday’s high at 1.1140 is now very important to hold insofar as the short-term EUR/USD outlook is concerned. If that breaks, then the April high at 1.1095 will be the next level to potentially provide support or else we will see a revisit of the more significant support around the 1.10 handle.
US PPI falls to slowest in 3 years
Weaker inflation data continued to drive risk-on trade across the financial markets, with equity indices on Wall Street hitting fresh 2023 highs, while several currency pairs broke out as well.
Following the release of weaker US CPI on Wednesday, which came in well below expectations and triggered a dollar sell-off, today’s PPI data further fuelled the disinflationary trade.
PPI rose just 0.1% year-over-year in June, down from 0.9% in May and below expectations for a 0.4% rise.
The Fed is winning its fight against inflation, by the looks of things, which calls into questions their strong hawkish stance and the likely decision to hike rates again come July 26.
-- Written by Fawad Razaqzada, Market Analyst
Follow Fawad on Twitter @Trader_F_R
How to trade with City Index
You can trade with City Index by following these four easy steps:
- Open an account, or log in if you’re already a customer
• Open an account in the UK
• Open an account in Australia
• Open an account in Singapore
- Search for the company you want to trade in our award-winning platform
- Choose your position and size, and your stop and limit levels
- Place the trade
Related tags:
Latest market news




The complete CFD trading experience
Award-winning platforms, competitive spreads, low commissions and dedicated support.
We live and breathe the markets and are dedicated to helping traders realise their ambitions as we continue to set the industry bar.
Economic calendar
Web Trader platform
Our sophisticated web-based platform is packed with features.
Related articles
USD/JPY Q4 2026 Outlook: Hawkish Fed Pricing Clashes With Intervention Risk
The year-end tug-of-war is clear: hawkish Fed pricing supports USD/JPY, while intervention risk limits the upside.
Japanese Yen Forecast: USD/JPY 4% Rally Challenges Post-Intervention Downtrend 9 24 2026
USD/JPY momentum has shifted sharply higher, putting a major resistance confluence in focus as U.S. and Japanese event risk builds.


Oil Quietly Hands the Fed a Reason to Stay Hawkish
Oil prices and the U.S. dollar are both on the front foot as elevated energy costs feed Fed warnings that inflation may prove sticky.
StoneX Europe Ltd may make third party material available on this website which may contain information included but not limited to the conditions of financial markets. The material is for information purposes only and does not contain, and should not be construed as containing, investment advice and/or investment recommendation and/or an investment research and/or an offer of or solicitation for any transactions in financial instruments; any decision to enter into a specific transaction shall be made by the client following an assessment by him/her of their situation.
StoneX Europe Ltd makes no representation or warranty and assumes no liability as to the accuracy or completeness of the information provided, nor any loss arising from any investment based on a recommendation, forecast or other information supplied. You should always seek independent advice as to your suitability to speculate in any related markets and your ability to assume the associated risks, if you are at all unsure. We are not under any obligation to update any such material. Any opinion made may be personal to the author and may not reflect the opinion of StoneX Europe Ltd.