






Euro Technical Forecast: EUR/USD, EUR/JPY Breakdowns
The Euro continued it’s Q4 descent against the US Dollar but it’s the recent build of bearish price action in EUR/JPY that’s of interest going into next week.
Share this:

Euro Talking Points:
- EUR/USD set a fresh two-year-low last week, breaching the 1.0500 level that had held support in 2023 and earlier in 2024 trade.
- EUR/JPY similarly broke down and interestingly, the Japanese Yen retained some strength against the US Dollar even as DXY flew to fresh two-year-highs. If we do see a continuation of Yen-strength ahead of next month’s BoJ policy review, EUR/JPY could be attractive for both Euro bears and JPY bulls.
- I’ll be looking at each of these markets in the Tuesday webinar ahead of next week’s release of FOMC minutes. You’re welcome to join: Click here for registration information.
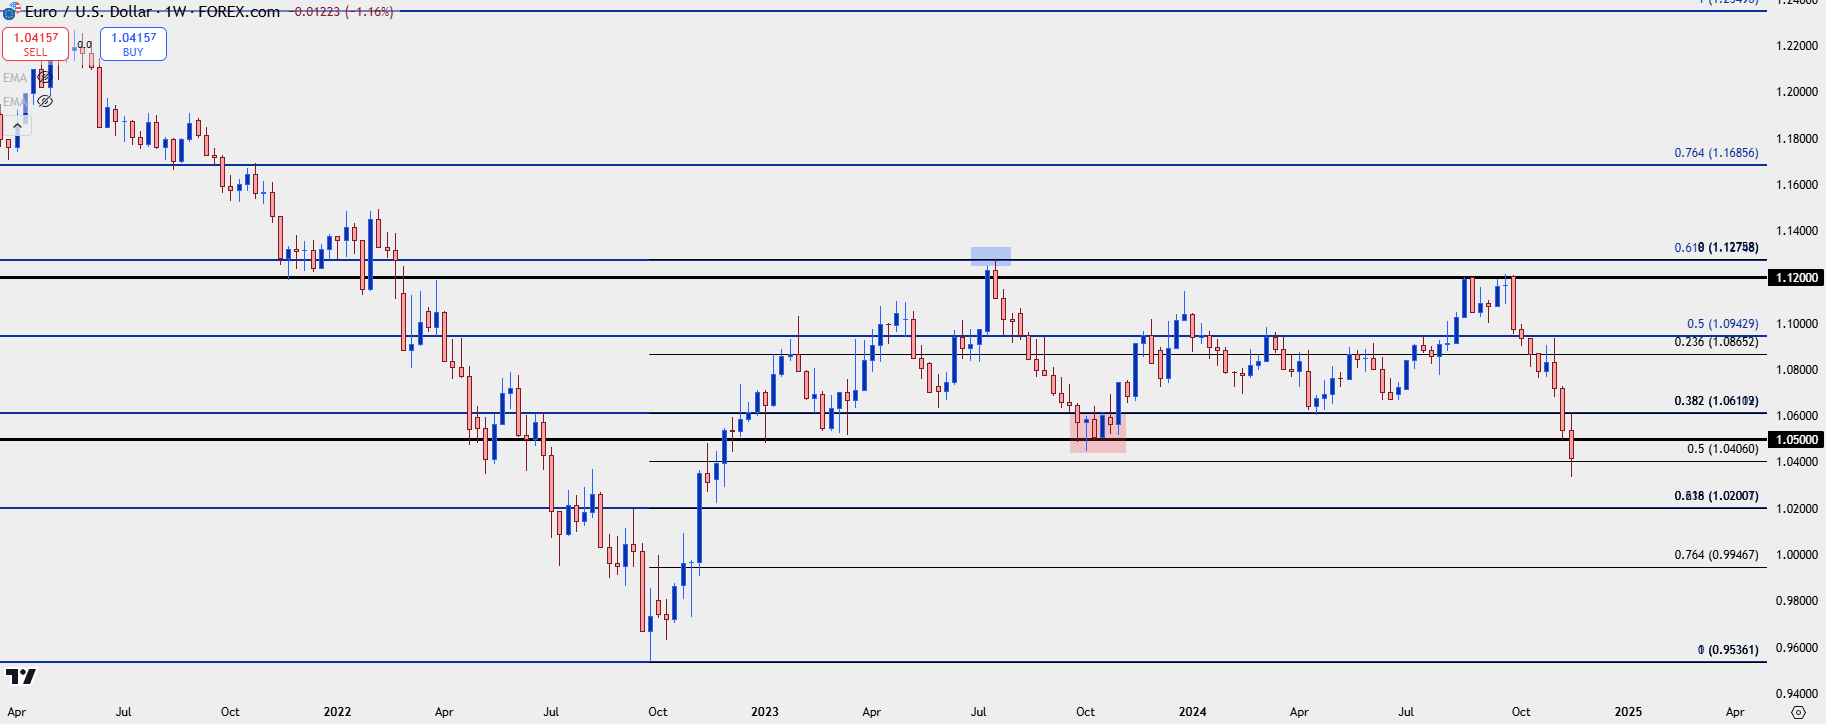
The Euro’s painful Q4 has continued through another week. It was just two months ago that many were touting Euro strength as EUR/USD grinded at resistance around the 1.1200 handle. But now that we’re a little more than halfway through Q4, a very different trend has taken-over.
Last week saw re-test of the same 1.0500 level that had set the lows in Q4 of last year, and that even led to a bit of a bounce. That bounce held through the weekly open, with prices pushing up for a re-test of the 1.0600 level and, eventually, a re-test of the 1.0611 Fibonacci level. And that’s around where bulls lost control and bears started to take back-over with a massive push in the back-half of the week to establish fresh two-year lows in EUR/USD.
That 1.0611 level seems particularly important. It’s the 38.2% Fibonacci retracement of the 2021-2022 major move, and the 61.8% retracement from that same setup is what helped to hold the highs last year. But, perhaps more importantly, the 23.6% retracement plots at 1.0200 and this would be the next support level below last week’s low. That price is also confluent with the 38.2% retracement of the 2022-2023 move, so there’s additional reference there for support potential above parity if sellers can continue driving the move early next week.
EUR/USD Weekly Chart
 Chart prepared by James Stanley, EUR/USD on Tradingview
EUR/USD Daily
From the daily chart we can see an extended underside wick from that Friday sell-off. And, notably, prices pushed back above the 50% mark of the 2022-2023 major move. That intra-day bounce provides a couple of different items of interest for next week as something like that can often be driven by profit taking after a breakdown type of move. If that bounce can continue, it sets the stage for another test of the 1.0500 handle. And if sellers do stretch the move, the low of 1.0333 becomes an ideal spot to look for a short-term support test given how quickly the bounce showed on Friday.
And if sellers can force a stretched move down to the 1.0200 handle, then 1.0333 becomes a spot of interest for lower-high resistance in continuation scenarios.
EUR/USD Daily Price Chart
 Chart prepared by James Stanley, EUR/USD on Tradingview
EUR/JPY
I looked at both EUR/USD and EUR/JPY on Thursday as the EUR/USD breakdown was beginning. And I had also looked at EUR/JPY on Wednesday afternoon, when it was testing a big spot of resistance at the 163.90 level.
On Wednesday I looked at EUR/JPY as a more attractive venue for Yen-strength scenarios and that’s what started to play out on Thursday morning. And as we wind towards the end of the week, the move in EUR/JPY even looks a bit cleaner, in my opinion, as the weekly low printed right at the 160.00 psychological level.
But, perhaps more to the point, both USD and EUR/USD are stretched. And while that does not preclude continuation, it does make the prospect of chasing each a bit more daunting. EUR/JPY, on the other hand, has been grinding a series of lower-lows and lower-highs and would seem to have potential for further development of bearish trends.
EUR/JPY Daily Price Chart
Chart prepared by James Stanley, EUR/JPY on Tradingview
USD Strength v/s Yen Strength
When comparing EUR/USD to EUR/JPY, the question would come down to what may have greater potential for strength in the days, weeks, or months ahead. From the chart with recent price action, the USD has clearly been the outlier there. But next month brings a policy review from the Bank of Japan and with USD/JPY starting to lag other major pairs this week, there could be an opportunity for bearish scenarios in USD/JPY. And if that comes to fruition, much like we saw in July and August, there could be an abundance of opportunity for trends in pairs like EUR/JPY.
This is just projection, of course, and we still can’t say that USD/JPY is in a bearish position from longer-term charts as the pair has continued to hold higher-lows. It is notable, however, that even as USD-strength was on full display against the Euro last week, USD/JPY failed to make a fresh high. But from the EUR/JPY chart, that bearish sequencing has been quite clear, and this provides some structure to work with as we move into next week.
Prior support swings around 162.04 and 163.21 could be of particular interest for bearish continuation setups in EUR/JPY.
EUR/JPY Four-Hour Chart
 Chart prepared by James Stanley, EUR/JPY on Tradingview
--- written by James Stanley, Senior Strategist
Euro Talking Points:
- EUR/USD set a fresh two-year-low last week, breaching the 1.0500 level that had held support in 2023 and earlier in 2024 trade.
- EUR/JPY similarly broke down and interestingly, the Japanese Yen retained some strength against the US Dollar even as DXY flew to fresh two-year-highs. If we do see a continuation of Yen-strength ahead of next month’s BoJ policy review, EUR/JPY could be attractive for both Euro bears and JPY bulls.
The Euro’s painful Q4 has continued through another week. It was just two months ago that many were touting Euro strength as EUR/USD grinded at resistance around the 1.1200 handle. But now that we’re a little more than halfway through Q4, a very different trend has taken-over.
Last week saw re-test of the same 1.0500 level that had set the lows in Q4 of last year, and that even led to a bit of a bounce. That bounce held through the weekly open, with prices pushing up for a re-test of the 1.0600 level and, eventually, a re-test of the 1.0611 Fibonacci level. And that’s around where bulls lost control and bears started to take back-over with a massive push in the back-half of the week to establish fresh two-year lows in EUR/USD.
That 1.0611 level seems particularly important. It’s the 38.2% Fibonacci retracement of the 2021-2022 major move, and the 61.8% retracement from that same setup is what helped to hold the highs last year. But, perhaps more importantly, the 23.6% retracement plots at 1.0200 and this would be the next support level below last week’s low. That price is also confluent with the 38.2% retracement of the 2022-2023 move, so there’s additional reference there for support potential above parity if sellers can continue driving the move early next week.
EUR/USD Weekly Chart
EUR/USD Daily
From the daily chart we can see an extended underside wick from that Friday sell-off. And, notably, prices pushed back above the 50% mark of the 2022-2023 major move. That intra-day bounce provides a couple of different items of interest for next week as something like that can often be driven by profit taking after a breakdown type of move. If that bounce can continue, it sets the stage for another test of the 1.0500 handle. And if sellers do stretch the move, the low of 1.0333 becomes an ideal spot to look for a short-term support test given how quickly the bounce showed on Friday.
And if sellers can force a stretched move down to the 1.0200 handle, then 1.0333 becomes a spot of interest for lower-high resistance in continuation scenarios.
EUR/USD Daily Price Chart
EUR/JPY
I looked at both EUR/USD and EUR/JPY on Thursday as the EUR/USD breakdown was beginning. And I had also looked at EUR/JPY on Wednesday afternoon, when it was testing a big spot of resistance at the 163.90 level.
On Wednesday I looked at EUR/JPY as a more attractive venue for Yen-strength scenarios and that’s what started to play out on Thursday morning. And as we wind towards the end of the week, the move in EUR/JPY even looks a bit cleaner, in my opinion, as the weekly low printed right at the 160.00 psychological level.
But, perhaps more to the point, both USD and EUR/USD are stretched. And while that does not preclude continuation, it does make the prospect of chasing each a bit more daunting. EUR/JPY, on the other hand, has been grinding a series of lower-lows and lower-highs and would seem to have potential for further development of bearish trends.
EUR/JPY Daily Price Chart
Chart prepared by James Stanley, EUR/JPY on Tradingview
USD Strength v/s Yen Strength
When comparing EUR/USD to EUR/JPY, the question would come down to what may have greater potential for strength in the days, weeks, or months ahead. From the chart with recent price action, the USD has clearly been the outlier there. But next month brings a policy review from the Bank of Japan and with USD/JPY starting to lag other major pairs this week, there could be an opportunity for bearish scenarios in USD/JPY. And if that comes to fruition, much like we saw in July and August, there could be an abundance of opportunity for trends in pairs like EUR/JPY.
This is just projection, of course, and we still can’t say that USD/JPY is in a bearish position from longer-term charts as the pair has continued to hold higher-lows. It is notable, however, that even as USD-strength was on full display against the Euro last week, USD/JPY failed to make a fresh high. But from the EUR/JPY chart, that bearish sequencing has been quite clear, and this provides some structure to work with as we move into next week.
Prior support swings around 162.04 and 163.21 could be of particular interest for bearish continuation setups in EUR/JPY.
EUR/JPY Four-Hour Chart
--- written by James Stanley, Senior Strategist
Latest market news



The complete CFD trading experience
Award-winning platforms, competitive spreads, low commissions and dedicated support.
We live and breathe the markets and are dedicated to helping traders realise their ambitions as we continue to set the industry bar.
Economic calendar
Web Trader platform
Our sophisticated web-based platform is packed with features.
Related articles
EUR/USD weekly outlook: Oil, inflation and NFP in focus
After coming under significant pressure in recent weeks, the EUR/USD came off its lows to finish the week on a positive note on Friday, albeit with only a mild rebound. That was not enough to prevent the exchange rate falling for the third consecutive week, as the US dollar and bond yields rallied across the board.
Gold Price Forecast: XAU/USD Avoids Breakdown as Yields Surged but Can it Continue?
Surging Treasury yields sent a jolt across markets last week but, so far, gold prices have held above the FOMC low. The big question now is whether that can continue and, if not, will bulls show up at $4100 or $4k like they did in June and July?
Gold Q4 2026 outlook: Resilience in the face of rallying dollar and yields
As we headed towards the latter stages of Q3 and into Q4, the Fed had just hiked rates in a hawkish FOMC meeting, while the likes of the ECB and BoJ had also tightened their respective policies. Oil prices remained elevated amid the prolonged US-Iran conflict. Meanwhile, bond yields were breaking out, and the dollar was higher across the board. Yet, remarkably, gold was still holding in the positive territory for the third quarter, even if it had weakened somewhat in September.
StoneX Europe Ltd may make third party material available on this website which may contain information included but not limited to the conditions of financial markets. The material is for information purposes only and does not contain, and should not be construed as containing, investment advice and/or investment recommendation and/or an investment research and/or an offer of or solicitation for any transactions in financial instruments; any decision to enter into a specific transaction shall be made by the client following an assessment by him/her of their situation.
StoneX Europe Ltd makes no representation or warranty and assumes no liability as to the accuracy or completeness of the information provided, nor any loss arising from any investment based on a recommendation, forecast or other information supplied. You should always seek independent advice as to your suitability to speculate in any related markets and your ability to assume the associated risks, if you are at all unsure. We are not under any obligation to update any such material. Any opinion made may be personal to the author and may not reflect the opinion of StoneX Europe Ltd.