





Euro Technical Outlook: EUR/USD Test II at 1.0500, EUR/JPY Breakdown
EUR/USD has taken a beating so far in Q4 but for the past week and the pair is testing the 1.0500 handle for a second time. For both Euro bears and Yen bulls, EUR/JPY could make for a more attractive argument for directional plays.
Share this:

Euro Talking Points:
- The single currency has been weak against both the US Dollar and Japanese Yen of late.
- EUR/USD is testing the 1.0500 level for a second time and earlier in the week, it looked like bulls would try to run a pullback from the first test. But as I said in the Tuesday webinar those tests of long-term levels can be messy, and that’s what’s over the past couple of days with price going down for another re-test as of this writing.
- EUR/JPY on the other hand could be a more attractive venue for Euro bears, especially given the recent injection of Yen-strength. I looked at the pair yesterday as a key point of resistance was holding on the chart.
The Q4 sell-off in EUR/USD hasn’t given way yet, although it was looking hopeful for bulls trying to bid swings earlier in the week. I looked at this in the webinar as there’d been a show of defense above the 1.0500 level that came into play last Thursday, leading to a series of higher-lows. But, the 1.0611 Fibonacci level traded later that night, and that led to another crush from sellers that made a fast run back towards that major psychological level.
But – that prior sell-off couldn’t quite cross the 1.0500 barrier and from the daily chart, and that price is in-play a week later.
I talked about this at-length in the Tuesday webinar, but these types of tests can take time, and it’s rare that there’s a cut-and-dry reversal, such as what was being teased then. When the 1.0500 level came into play in Q4 of last year, it was tested for about four weeks before bulls could ultimately begin to start taking control again. And in that instance, there was even testing below the big figure, with sellers driving about 50 pips lower before ultimately being rebuffed by bulls. That episode highlighted a degree of capitulation, similar to what showed on the other side of EUR/USD at the 1.1200 handle in late-September.
At this point, sellers are going down for another test of the 1.0500 psychological level, and this can be a very difficult move to chase.
EUR/USD Daily Chart
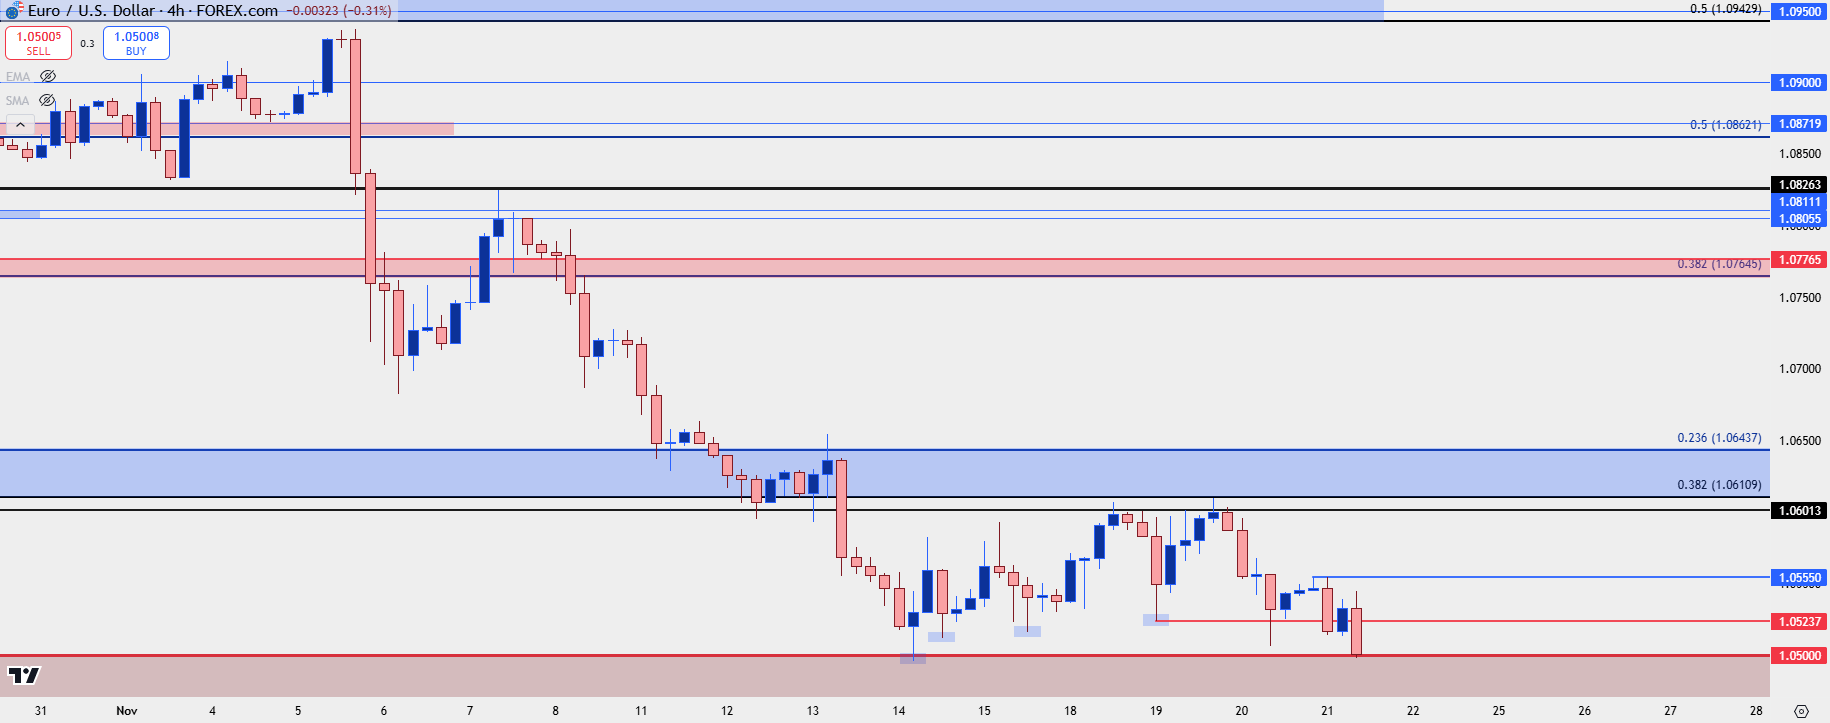 Chart prepared by James Stanley, EUR/USD on Tradingview
EUR/USD Bigger Picture
For some perspective we can draw back to the weekly chart and see that the pair is still within the two-year range. This also highlights last year's test at the 1.0500 level, with the big figure not being the absolute low as that showed about 50 pips lower. So, while bears do remain in-control, the challenge at this point would be chasing a move at a really big spot of longer-term support on the chart.
EUR/USD Weekly Chart
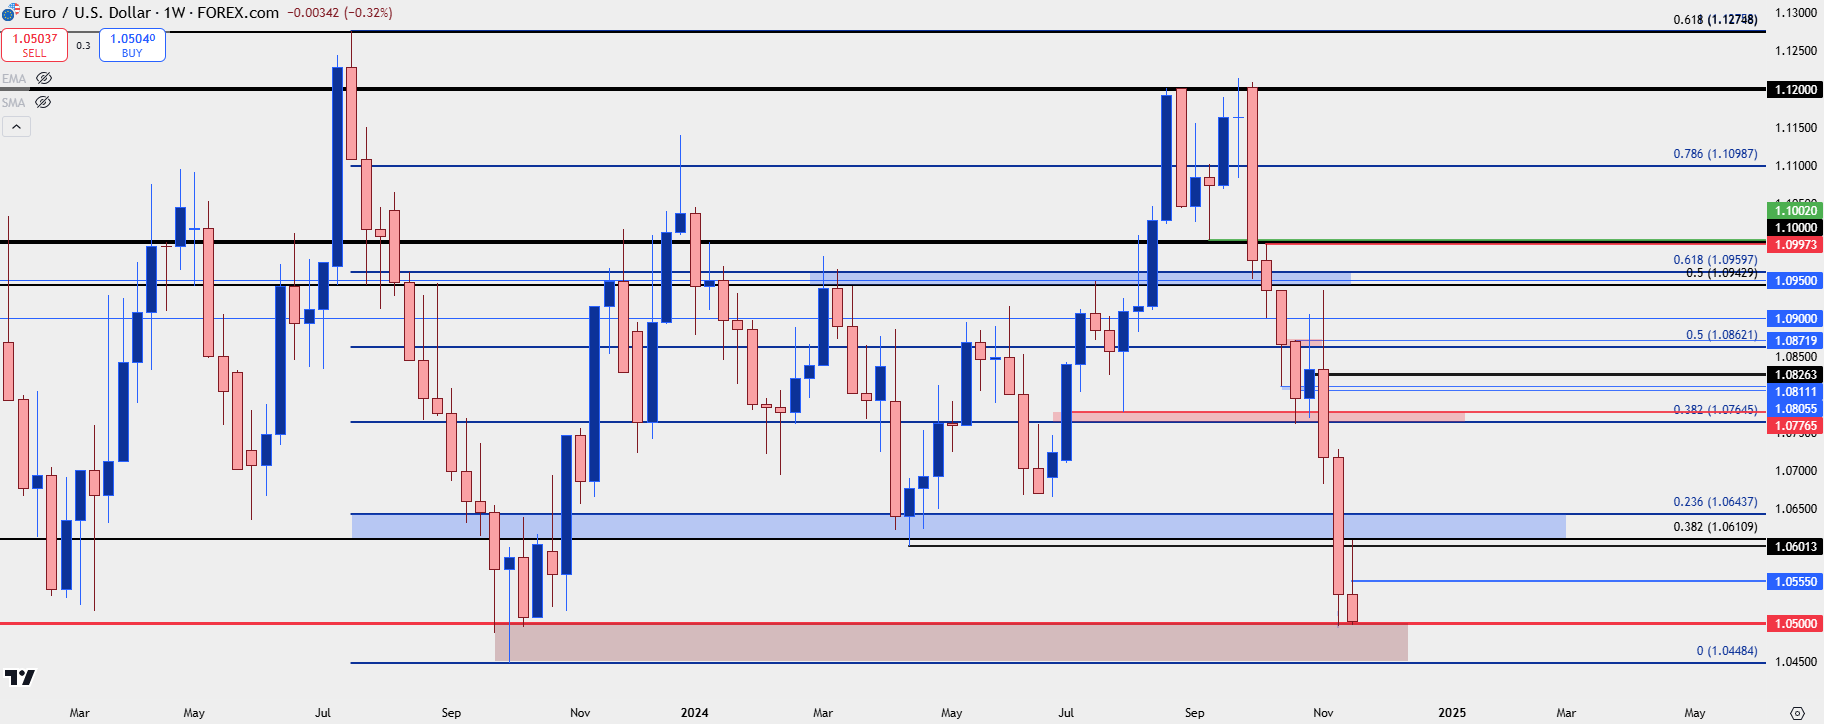 Chart prepared by James Stanley, EUR/USD on Tradingview
EUR/JPY
While EUR/USD has been indecisive this week, EUR/JPY has been a bit more directional. I looked at the pair yesterday when looking across the Japanese Yen and as I shared then, this could be an attractive venue for those looking for Yen-strength. On that topic, there’s an upcoming policy review from the Bank of Japan expected next month, and in a speech last night, BoJ Governor Kazuo Ueda sounded somewhat hawkish which has led to a run of Yen-strength against all of USD/JPY, GBP/JPY and EUR/JPY.
In EUR/JPY, there’s been a recent build of bearish structure and if that Yen-strength theme does continue to play-out, given the backdrop of economic weakness in the Euro-zone which has helped EUR/USD to fling all the way down to 1.0500, the single currency could be an attractive venue for looking for JPY strength to continue.
As of yesterday’s article, and video, the pair was holding at a key spot on the chart of 163.90. This was prior resistance in the ascending triangle formation, which then turned into support last week.
But the bounce from that support held a lower-high at 165.00, which was confluent with the 200-day moving average.
EUR/JPY Daily Chart
 Chart prepared by James Stanley, EUR/JPY on Tradingview
From the four-hour chart, EUR/JPY is already very close to a support level at 162.00, which is the 38.2% retracement of the August-October rally. That could make the pair a difficult venue to chase, but it does set the stage for a possible pullback and for that, there’s a couple of spots of interest for lower-high resistance potential.
The level at 163.21 sticks out as key as that price had come into the picture a couple of different times as support, including the prior low before the recent sell-off pushed down towards 162.00.
Above that, we have the level looked at yesterday at 163.90, and this is what sellers would need to hold price below to retain control of the near-term trend. And, more aggressively, if sellers can hold the 162.72-162.80 zone, then the prospect of bearish momentum continuing down for another test of the 162.00 level would look more attractive.
For next support, the currently monthly low plots 50 pips below that Fibonacci level at 161.50, after which another Fibonacci level from the same sequence comes into play at 160.5, followed by the 160.00 psychological level.
EUR/JPY Four-Hour Price Chart
 Chart prepared by James Stanley, EUR/JPY on Tradingview
--- written by James Stanley, Senior Strategist
Euro Talking Points:
- The single currency has been weak against both the US Dollar and Japanese Yen of late.
- EUR/USD is testing the 1.0500 level for a second time and earlier in the week, it looked like bulls would try to run a pullback from the first test. But as I said in the Tuesday webinar those tests of long-term levels can be messy, and that’s what’s over the past couple of days with price going down for another re-test as of this writing.
- EUR/JPY on the other hand could be a more attractive venue for Euro bears, especially given the recent injection of Yen-strength. I looked at the pair yesterday as a key point of resistance was holding on the chart.
The Q4 sell-off in EUR/USD hasn’t given way yet, although it was looking hopeful for bulls trying to bid swings earlier in the week. I looked at this in the webinar as there’d been a show of defense above the 1.0500 level that came into play last Thursday, leading to a series of higher-lows. But, the 1.0611 Fibonacci level traded later that night, and that led to another crush from sellers that made a fast run back towards that major psychological level.
But – that prior sell-off couldn’t quite cross the 1.0500 barrier and from the daily chart, there’s been continued testing of the big figure.
I talked about this at-length in the Tuesday webinar, but these types of tests can take time, and it’s rare that there’s a cut-and-dry reversal, such as what was being teased then. When the 1.0500 level came into play in Q4 of last year, it was tested for about four weeks before bulls could ultimately begin to start taking control again. And in that instance, there was even testing below the big figure, with sellers driving about 50 pips lower before ultimately being rebuffed by bulls. That episode highlighted a degree of capitulation, similar to what showed on the other side of EUR/USD at the 1.1200 handle in late-September.
At this point, sellers are going down for another test of the 1.0500 psychological level, and this can be a very difficult move to chase.
EUR/USD Daily Chart
EUR/USD Bigger Picture
For some perspective we can draw back to the weekly chart and see that the pair is still within the two-year range. This also highlights last year's test at the 1.0500 level, with the big figure not being the absolute low as that showed about 50 pips lower. So, while bears do remain in-control, the challenge at this point would be chasing a move at a really big spot of longer-term support on the chart.
EUR/USD Weekly Chart
EUR/JPY
While EUR/USD has been indecisive this week, EUR/JPY has been a bit more directional. I looked at the pair yesterday when looking across the Japanese Yen and as I shared then, this could be an attractive venue for those looking for Yen-strength. On that topic, there’s an upcoming policy review from the Bank of Japan expected next month, and in a speech last night, BoJ Governor Kazuo Ueda sounded somewhat hawkish which has led to a run of Yen-strength against all of USD/JPY, GBP/JPY and EUR/JPY.
In EUR/JPY, there’s been a recent build of bearish structure and if that Yen-strength theme does continue to play-out, given the backdrop of economic weakness in the Euro-zone which has helped EUR/USD to fling all the way down to 1.0500, the single currency could be an attractive venue for looking for JPY strength to continue.
As of yesterday’s article, and video, the pair was holding at a key spot on the chart of 163.90. This was prior resistance in the ascending triangle formation, which then turned into support last week.
But the bounce from that support held a lower-high at 165.00, which was confluent with the 200-day moving average.
EUR/JPY Daily Chart
From the four-hour chart, EUR/JPY is already very close to a support level at 162.00, which is the 38.2% retracement of the August-October rally. That could make the pair a difficult venue to chase, but it does set the stage for a possible pullback and for that, there’s a couple of spots of interest for lower-high resistance potential.
The level at 163.21 sticks out as key as that price had come into the picture a couple of different times as support, including the prior low before the recent sell-off pushed down towards 162.00.
Above that, we have the level looked at yesterday at 163.90, and this is what sellers would need to hold price below to retain control of the near-term trend. And, more aggressively, if sellers can hold the 162.72-162.80 zone, then the prospect of bearish momentum continuing down for another test of the 162.00 level would look more attractive.
For next support, the currently monthly low plots 50 pips below that Fibonacci level at 161.50, after which another Fibonacci level from the same sequence comes into play at 160.5, followed by the 160.00 psychological level.
EUR/JPY Four-Hour Price Chart
--- written by James Stanley, Senior Strategist
Related tags:
Latest market news




The complete CFD trading experience
Award-winning platforms, competitive spreads, low commissions and dedicated support.
We live and breathe the markets and are dedicated to helping traders realise their ambitions as we continue to set the industry bar.
Economic calendar
Web Trader platform
Our sophisticated web-based platform is packed with features.
Related articles
RBA delivers 25bp hike, Bullock now the main event
The RBA delivered the expected 25bp hike, but Bullock’s press conference now looms as the bigger volatility risk for AUD/USD and the ASX 200.
Gold outlook: XAU/USD hammered, stretched and vulnerable to a sharp rebound
Gold is getting hammered for solid fundamental reasons, but history suggests extreme four-hourly oversold conditions can produce violent countertrend rallies.
Gold forecast: Rising yields become too hot for gold, but the outlook is far from bearish
Gold and silver prices took a plunge today, with the former down 3% and the latter falling some 5% by mid European session, before bouncing off their lows. The losses come after the metals remained largely supported until last week, despite the big dollar rally and surging bond yields as we have seen in recent weeks. But it simply got too much, and the metals succumbed to pressure today.

StoneX Europe Ltd may make third party material available on this website which may contain information included but not limited to the conditions of financial markets. The material is for information purposes only and does not contain, and should not be construed as containing, investment advice and/or investment recommendation and/or an investment research and/or an offer of or solicitation for any transactions in financial instruments; any decision to enter into a specific transaction shall be made by the client following an assessment by him/her of their situation.
StoneX Europe Ltd makes no representation or warranty and assumes no liability as to the accuracy or completeness of the information provided, nor any loss arising from any investment based on a recommendation, forecast or other information supplied. You should always seek independent advice as to your suitability to speculate in any related markets and your ability to assume the associated risks, if you are at all unsure. We are not under any obligation to update any such material. Any opinion made may be personal to the author and may not reflect the opinion of StoneX Europe Ltd.