





Japanese Yen Technical Analysis: USD/JPY, EUR/JPY, GBP/JPY
USD/JPY has continued to rally up to fresh three-month-highs, but EUR/JPY has started to build bearish structure. Meanwhile a bull pennant has formed in GBP/JPY.
Share this:

Japanese Yen Talking Points:
- USD/JPY has broken out to a fresh three-month-high to go along with the rally in USD, which has now filled the gap from last November’s FOMC rate decision.
- EUR/JPY has so far held below the 165.00 handle which is an area of prior support. For those looking for Yen-strength, that may be a more attractive venue than USD/JPY given recent technical items.
- GBP/JPY price action has narrowed into a symmetrical triangle this month and given the prior bullish trend, that can be argued as a bull pennant formation. The 198.08 level is holding as short-term resistance this week and that’s the spot that bulls need to leave behind to re-take control of the trend.
USD/JPY is trading at a fresh three-month high today, continuing the breakout from 155.00 that started yesterday. This would make for the fourth consecutive daily gain in the pair, following two days of pullback last week that showed on the day of FOMC and the Friday after.
As I had discussed yesterday, USD/JPY still seems to be one of the more attractive venues for USD-strength scenarios and even though DXY showed a strong intra-day reversal after filling the remaining unfilled gap from last year, USD/JPY has held up a bit better so far. And on a broader basis, last week saw a hold of the 200-day moving average ahead of election results and that similarly helps to paint a bullish picture for the pair.
The challenge at this point is chasing while at fresh highs. For pullbacks, ideally, bulls would hold support in that same zone of prior resistance around the 155.00 level. For next resistance, I’m tracking a Fibonacci level at 156.67 and then a prior swing from May and July at 157.71.
USD/JPY Daily Price Chart
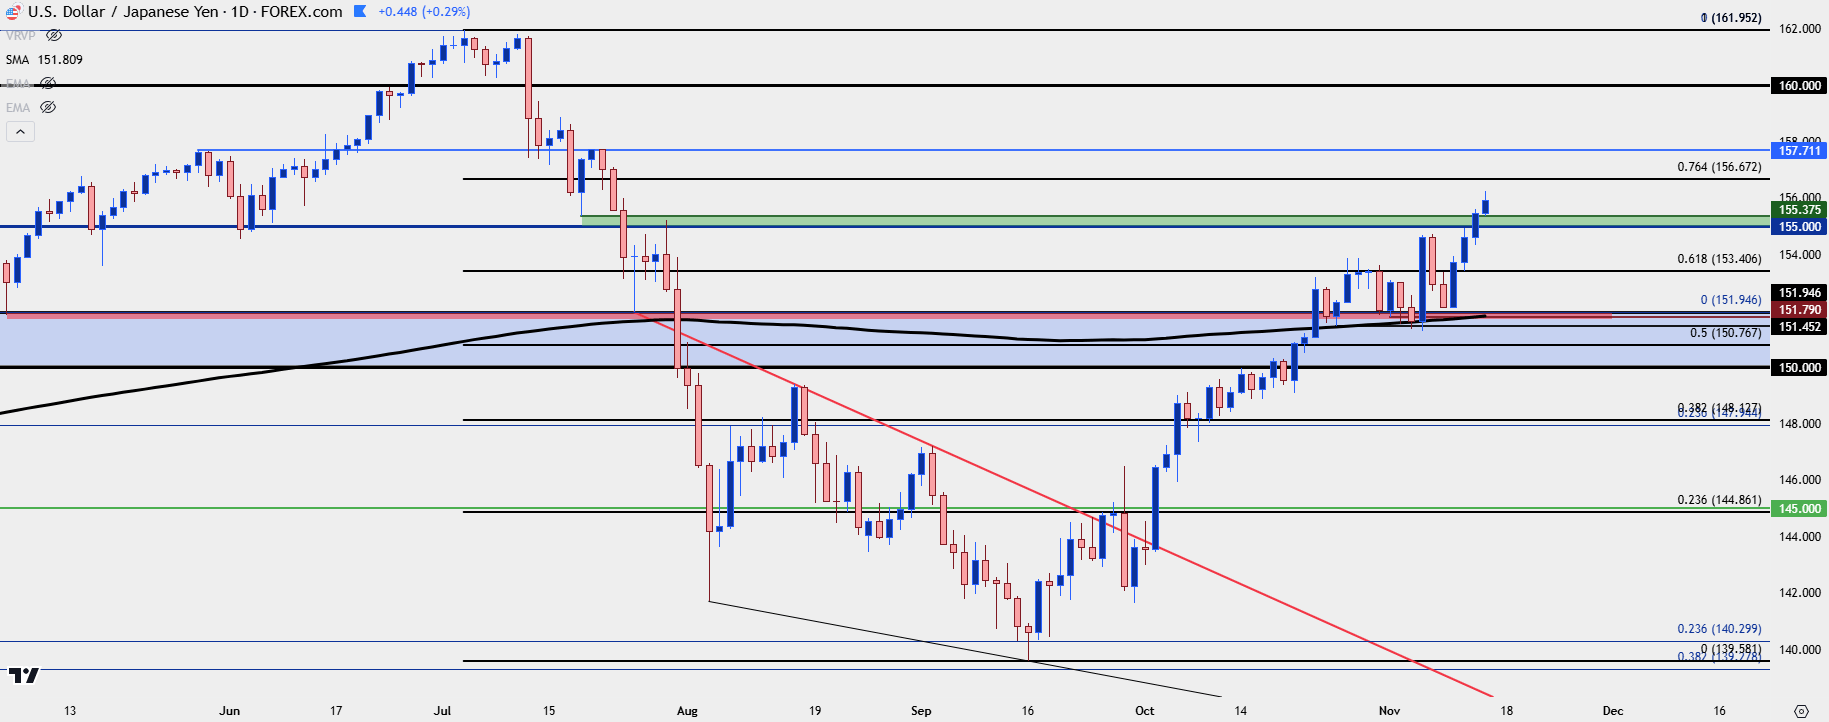 Chart prepared by James Stanley, USD/JPY on Tradingview
EUR/JPY
It’s been a rough start to Q4 for the Euro and that’s especially true in EUR/USD, where the pair has fallen by as much as 700 pips from the resistance at 1.1200 to this morning’s test of 1.0500.
In EUR/JPY, however, the bearish theme has been a bit more formulaic, with respect of prior price structure. A bearish engulf printed on October 31st and that initially held support at 165.00. The bounce from that retained a lower-high, and then last Thursday and Friday saw another leg-lower with support holding around 163.20.
But the bounce from that has so far held resistance at prior support of 165.00 and for those that are looking for venues of Yen-strength, that can present a compelling backdrop. For deeper resistance, there’s a prior swing at 165.34 and for deeper support, a point of resistance-turned-support at 161.93.
EUR/JPY Daily Chart
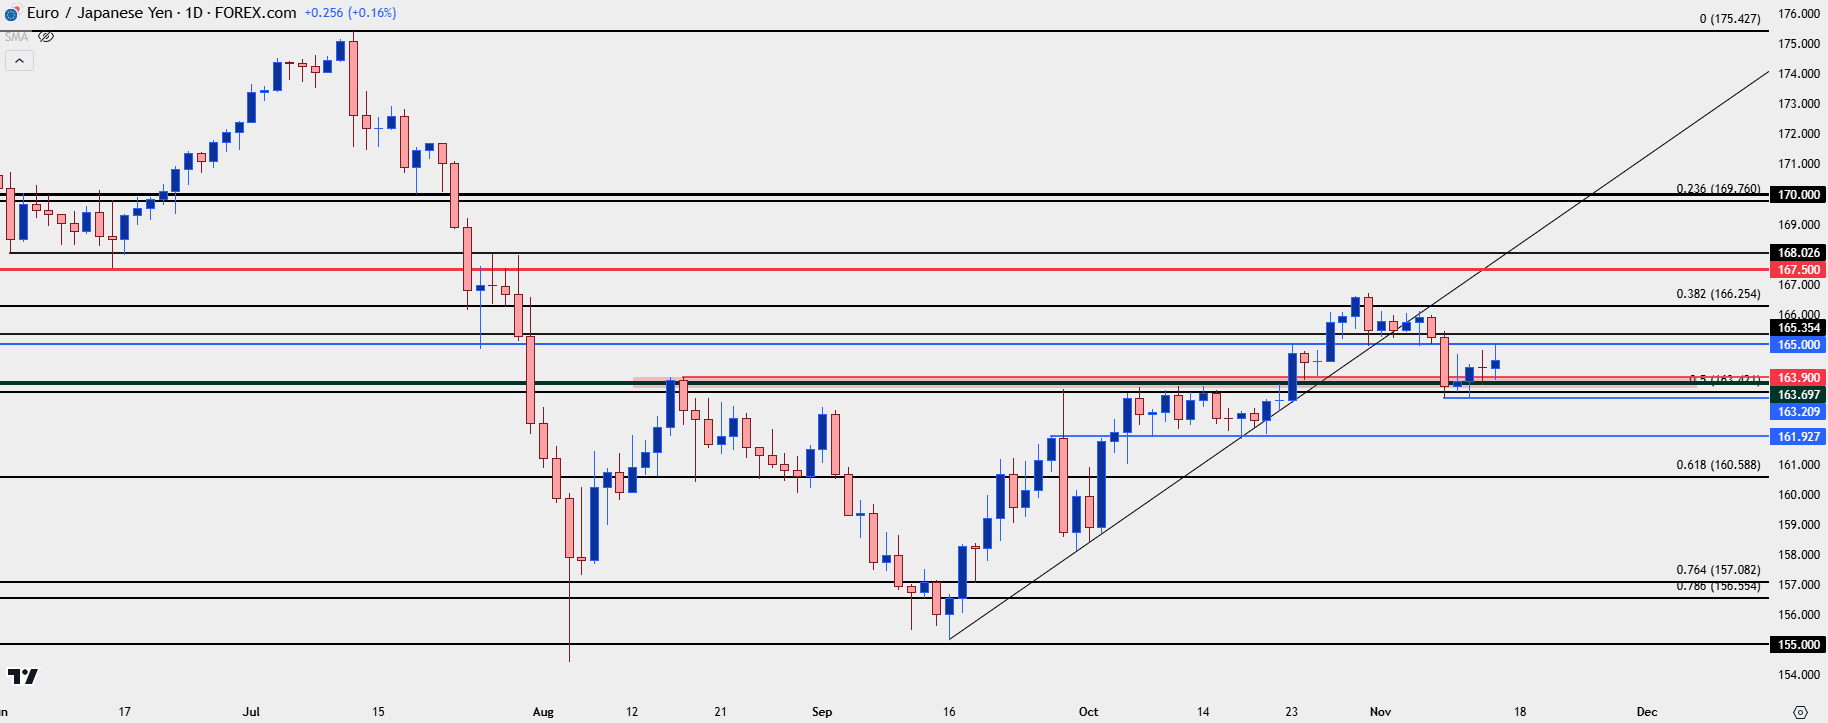 Chart prepared by James Stanley, EUR/JPY on Tradingview
GBP/JPY
While USD/JPY retains a bullish posture with higher-highs and lows and EUR/JPY a bearish lean with lower-lows and highs, GBP/JPY is somewhere in the middle and so far Q4 has been a period of digestion for the pair. There’s been both lower-highs and higher-lows as price action has narrowed into a symmetrical triangle formation and normally, that comes with no directional bias, in and of itself. But, in this case given the prior bullish trend, a claim can be made that this is a bull pennant which would indicate digestion after a bullish trend that continues to lean towards topside continuation.
There are some key levels sitting overhead and the major item is the 200.00 handle, which bulls came within 20 pips of in late-October before allowing the pair to pullback. And for today, it’s a familiar level at 198.08 that continues to hold resistance and that’s been the case for pretty much all of this week.
GBP/JPY Daily Chart
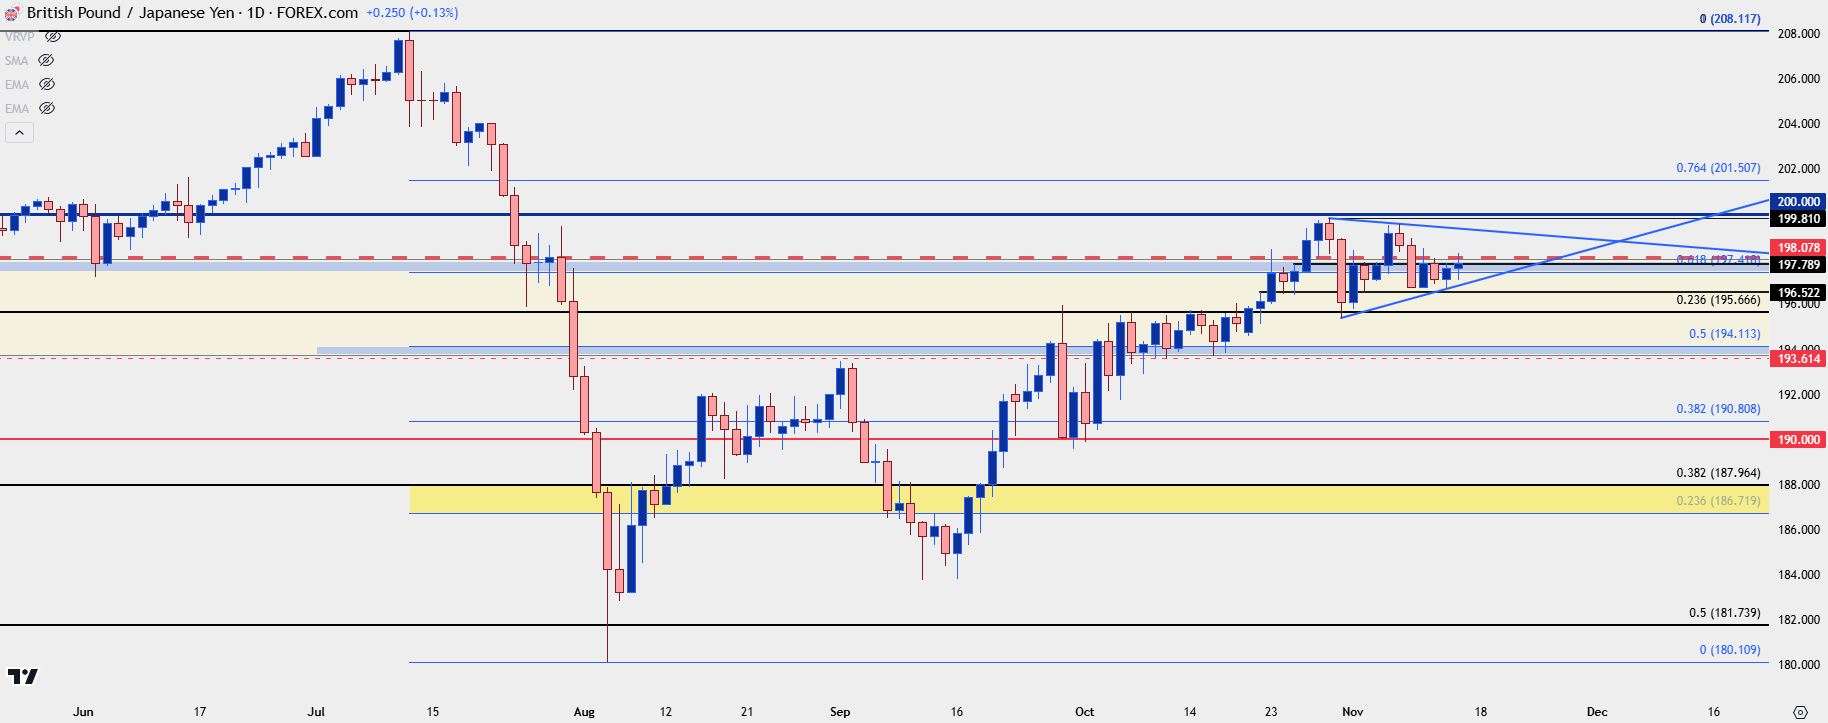 Chart prepared by James Stanley, GBP/JPY on Tradingview
--- written by James Stanley, Senior Strategist
Japanese Yen Talking Points:
- USD/JPY has broken out to a fresh three-month-high to go along with the rally in USD, which has now filled the gap from last November’s FOMC rate decision.
- EUR/JPY has so far held below the 165.00 handle which is an area of prior support. For those looking for Yen-strength, that may be a more attractive venue than USD/JPY given recent technical items.
- GBP/JPY price action has narrowed into a symmetrical triangle this month and given the prior bullish trend, that can be argued as a bull pennant formation. The 198.08 level is holding as short-term resistance this week and that’s the spot that bulls need to leave behind to re-take control of the trend.
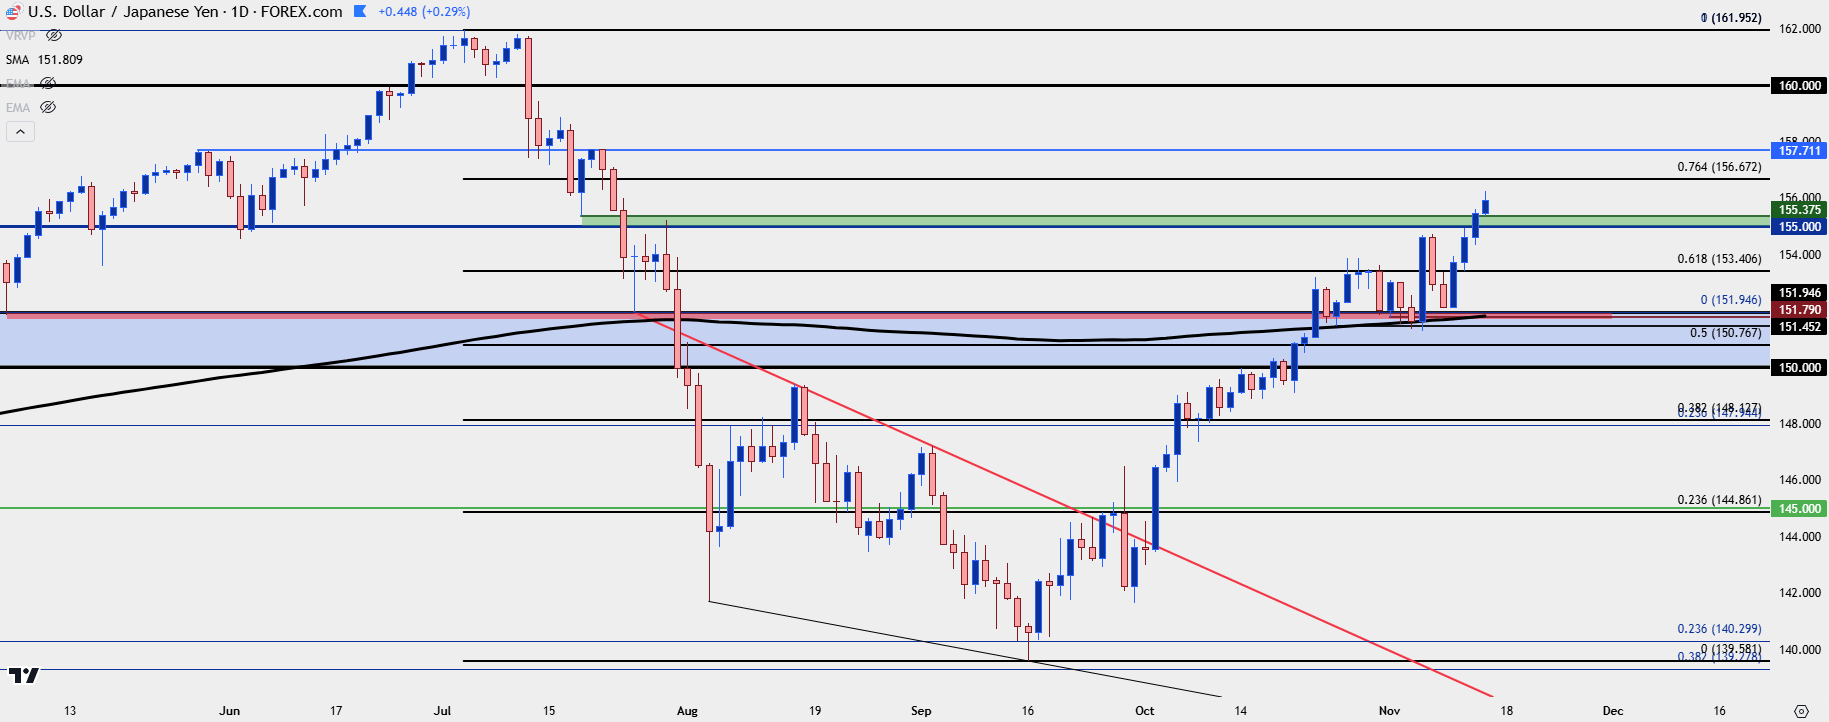
USD/JPY is trading at a fresh three-month high today, continuing the breakout from 155.00 that started yesterday. This would make for the fourth consecutive daily gain in the pair, following two days of pullback last week that showed on the day of FOMC and the Friday after.
As I had discussed yesterday, USD/JPY still seems to be one of the more attractive venues for USD-strength scenarios and even though DXY showed a strong intra-day reversal after filling the remaining unfilled gap from last year, USD/JPY has held up a bit better so far. And on a broader basis, last week saw a hold of the 200-day moving average ahead of election results and that similarly helps to paint a bullish picture for the pair.
The challenge at this point is chasing while at fresh highs. For pullbacks, ideally, bulls would hold support in that same zone of prior resistance around the 155.00 level. For next resistance, I’m tracking a Fibonacci level at 156.67 and then a prior swing from May and July at 157.71.
USD/JPY Daily Price Chart
EUR/JPY
It’s been a rough start to Q4 for the Euro and that’s especially true in EUR/USD, where the pair has fallen by as much as 700 pips from the resistance at 1.1200 to this morning’s test of 1.0500.
In EUR/JPY, however, the bearish theme has been a bit more formulaic, with respect of prior price structure. A bearish engulf printed on October 31st and that initially held support at 165.00. The bounce from that retained a lower-high, and then last Thursday and Friday saw another leg-lower with support holding around 163.20.
But the bounce from that has so far held resistance at prior support of 165.00 and for those that are looking for venues of Yen-strength, that can present a compelling backdrop. For deeper resistance, there’s a prior swing at 165.34 and for deeper support, a point of resistance-turned-support at 161.93.
EUR/JPY Daily Chart
GBP/JPY
While USD/JPY retains a bullish posture with higher-highs and lows and EUR/JPY a bearish lean with lower-lows and highs, GBP/JPY is somewhere in the middle and so far Q4 has been a period of digestion for the pair. There’s been both lower-highs and higher-lows as price action has narrowed into a symmetrical triangle formation and normally, that comes with no directional bias, in and of itself. But, in this case given the prior bullish trend, a claim can be made that this is a bull pennant which would indicate digestion after a bullish trend that continues to lean towards topside continuation.
There are some key levels sitting overhead and the major item is the 200.00 handle, which bulls came within 20 pips of in late-October before allowing the pair to pullback. And for today, it’s a familiar level at 198.08 that continues to hold resistance and that’s been the case for pretty much all of this week.
GBP/JPY Daily Chart
--- written by James Stanley, Senior Strategist
Related tags:
Latest market news




The complete CFD trading experience
Award-winning platforms, competitive spreads, low commissions and dedicated support.
We live and breathe the markets and are dedicated to helping traders realise their ambitions as we continue to set the industry bar.
Economic calendar
Web Trader platform
Our sophisticated web-based platform is packed with features.
Related articles
Gold Rallies Towards a $4k Test – but Can Bulls Break the Trend?
Gold prices melted down last week but so far this week, a different tone has taken over. But can this turn into anything more than a short squeeze?
Gold forecast: XAU/USD stabilised after recent falls – for now
Gold has started the first week of the new month trying to recover some ground after another bruising week. Oil prices have taken a sharp drop and that has allowed risk assets to bounce back, which has clearly helped the precious metal too. However, with sentiment remaining bearish towards the metals, and with $4000 level having been taken out last week, the path of least resistance is to the downside for gold.


GBP/USD outlook: Currency Pair of the Week | November 2, 2026
The GBP/USD heads into a crowded week of event risk, with the midterm elections, a Bank of England rate decision and Friday's non-farm payrolls report all capable of moving markets sharply. The greenback remains fundamentally well supported by a hawkish Federal Reserve, but much of that is already priced in, while the renewed sell-off in technology stocks has exposed its vulnerability.
StoneX Europe Ltd may make third party material available on this website which may contain information included but not limited to the conditions of financial markets. The material is for information purposes only and does not contain, and should not be construed as containing, investment advice and/or investment recommendation and/or an investment research and/or an offer of or solicitation for any transactions in financial instruments; any decision to enter into a specific transaction shall be made by the client following an assessment by him/her of their situation.
StoneX Europe Ltd makes no representation or warranty and assumes no liability as to the accuracy or completeness of the information provided, nor any loss arising from any investment based on a recommendation, forecast or other information supplied. You should always seek independent advice as to your suitability to speculate in any related markets and your ability to assume the associated risks, if you are at all unsure. We are not under any obligation to update any such material. Any opinion made may be personal to the author and may not reflect the opinion of StoneX Europe Ltd.