





Euro Technical Forecast: EUR/USD Revisits 1.0500
EUR/USD sellers have had an open door to drive towards parity in 2025 but they’ve continually failed to take advantage, begging the question as to whether bullish reversals may soon show.
Share this:

Euro, EUR/USD Talking Points:
- EUR/USD battled the 1.0500 psychological level as the pair opened on Monday with resistance at the level and then found resistance there again on Thursday.
- The tariff topic continues to dominate and the fear of auto tariffs from the U.S. has helped to keep support in-play for USD at the 106.61 level and that’s equated to resistance in EUR/USD around 1.0500.
- The big takeaway right now for EUR/USD is deductive, where sellers have continually had an open door to take the pair down to fresh lows in February but have continually failed to do so. Bulls haven’t exactly taken away with matters as resistance holds around 1.0500, but that lack of bearish drive could soon lead to breakout potential in the pair.
- I’ll be looking into both EUR/USD and the U.S. Dollar in-depth in the Tuesday webinar, and you’re welcome to join. Click here for registration information.
The 1.0500 level has been a tricky spot so far for EUR/USD traders in 2025. The pair fell from that price on December 18th, the day of the last FOMC rate cut, and it was back in-play in late January as it helped to form an evening star pattern. That evening star held the highs until last Friday, when 1.0500 was back in the picture as resistance.
Between those two occurrences was a sell-off in the pair that was largely pushed by the threat of tariffs. Trump had announced in early-February that tariffs would be coming to Europe ‘pretty soon.’ And in the first week of the month he warned of reciprocal tariffs, which was largely implying a focus on European products. That threat of reciprocal tariffs helped EUR/USD to hold resistance at a confluent spot of Fibonacci levels, but the pullback from that resistance showed another higher-low, with buyers taking over a week later when details of the reciprocal tariffs actually hit the headlines.
While reciprocal tariffs could have a large impact on Europe, the fact that they were announced for an April 1st implementation date led many to think that it’s more of a negotiation tactic than an actual threat. The pair broke-out above the 1.0400 resistance as reciprocal tariffs were announced and that’s what helped to drive that 1.0500 test; the pullback of which held support at prior resistance on Wednesday of this week at the same 1.0400 handle.
I had talked about this setup in the Tuesday webinar and as I shared then, the 1.0400 area has held a higher-low with price pushing right back up to the 1.0500 handle.
EUR/USD Daily Price Chart

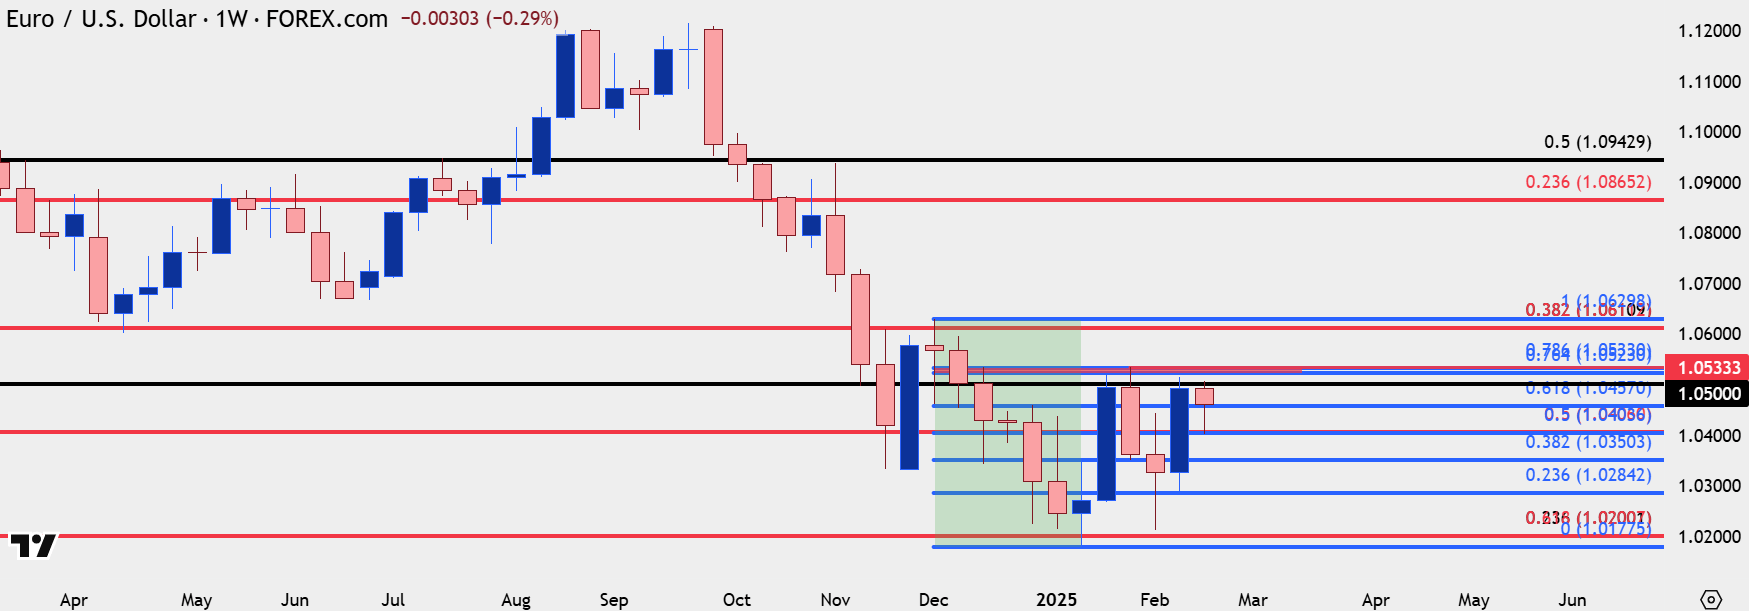
From the weekly chart we can see the importance of that 1.0500 level, which has held the highs in the pair since mid-December, the week of the FOMC rate decision. But more recently it’s the higher-lows that have printed, with prices holding above the 1.0200 inflection in January, even as tariff threats were getting priced-in earlier in February. This retains breakout potential in the pair and if bulls can grind above the 1.0500 handle, the next major level is the 1.0611 Fibonacci level that had set the highs in early-December, on the day of the NFP release.
EUR/USD Weekly Price Chart
--- written by James Stanley, Senior Strategist
Euro, EUR/USD Talking Points:
- EUR/USD battled the 1.0500 psychological level as the pair opened on Monday with resistance at the level and then found resistance there again on Thursday.
- The tariff topic continues to dominate and the fear of auto tariffs from the U.S. has helped to keep support in-play for USD at the 106.61 level and that’s equated to resistance in EUR/USD around 1.0500.
- The big takeaway right now for EUR/USD is deductive, where sellers have continually had an open door to take the pair down to fresh lows in February but have continually failed to do so. Bulls haven’t exactly taken away with matters as resistance holds around 1.0500, but that lack of bearish drive could soon lead to breakout potential in the pair.
- I’ll be looking into both EUR/USD and the U.S. Dollar in-depth in the Tuesday webinar, and you’re welcome to join. Click here for registration information.
The 1.0500 level has been a tricky spot so far for EUR/USD traders in 2025. The pair fell from that price on December 18th, the day of the last FOMC rate cut, and it was back in-play in late January as it helped to form an evening star pattern. That evening star held the highs until last Friday, when 1.0500 was back in the picture as resistance.
Between those two occurrences was a sell-off in the pair that was largely pushed by the threat of tariffs. Trump had announced in early-February that tariffs would be coming to Europe ‘pretty soon.’ And in the first week of the month he warned of reciprocal tariffs, which was largely implying a focus on European products. That threat of reciprocal tariffs helped EUR/USD to hold resistance at a confluent spot of Fibonacci levels, but the pullback from that resistance showed another higher-low, with buyers taking over a week later when details of the reciprocal tariffs actually hit the headlines.
While reciprocal tariffs could have a large impact on Europe, the fact that they were announced for an April 1st implementation date led many to think that it’s more of a negotiation tactic than an actual threat. The pair broke-out above the 1.0400 resistance as reciprocal tariffs were announced and that’s what helped to drive that 1.0500 test; the pullback of which held support at prior resistance on Wednesday of this week at the same 1.0400 handle.
I had talked about this setup in the Tuesday webinar and as I shared then, the 1.0400 area has held a higher-low with price pushing right back up to the 1.0500 handle.
EUR/USD Daily Price Chart
From the weekly chart we can see the importance of that 1.0500 level, which has held the highs in the pair since mid-December, the week of the FOMC rate decision. But more recently it’s the higher-lows that have printed, with prices holding above the 1.0200 inflection in January, even as tariff threats were getting priced-in earlier in February. This retains breakout potential in the pair and if bulls can grind above the 1.0500 handle, the next major level is the 1.0611 Fibonacci level that had set the highs in early-December, on the day of the NFP release.
EUR/USD Weekly Price Chart
--- written by James Stanley, Senior Strategist
Related tags:




The complete CFD trading experience
Award-winning platforms, competitive spreads, low commissions and dedicated support.
We live and breathe the markets and are dedicated to helping traders realise their ambitions as we continue to set the industry bar.
Economic calendar
Web Trader platform
Our sophisticated web-based platform is packed with features.
Related articles

Japanese Yen Technical Analysis: USD/JPY Support Test into Core PCE
USD/JPY has been a battlefield for the past two months as the force of intervention and the threat of more have given sellers an advantage, even as buyers have continued to bid support on pullbacks. This sets the stage for a massive finish to the week with Core PCE and Non-farm Payrolls.

Euro Forecast: EUR/USD Tumbles Towards Yearly Low as Daily RSI Goes Oversold
EUR/USD has been hit hard in the final month of the quarter as USD strength has shown up in a big way. With the pair set to challenge its yearly low as RSI has pushed into oversold territory, is there a chance for a pullback with some big headline risk hitting in the US over the next few days?

EUR/USD, USD/JPY Outlook: Oil, yields and an FX identity crisis
Crude oil is setting the tone across rates and FX, leaving EUR/USD vulnerable and USD/JPY caught between higher Treasury yields and the growing threat of intervention

StoneX Europe Ltd may make third party material available on this website which may contain information included but not limited to the conditions of financial markets. The material is for information purposes only and does not contain, and should not be construed as containing, investment advice and/or investment recommendation and/or an investment research and/or an offer of or solicitation for any transactions in financial instruments; any decision to enter into a specific transaction shall be made by the client following an assessment by him/her of their situation.
StoneX Europe Ltd makes no representation or warranty and assumes no liability as to the accuracy or completeness of the information provided, nor any loss arising from any investment based on a recommendation, forecast or other information supplied. You should always seek independent advice as to your suitability to speculate in any related markets and your ability to assume the associated risks, if you are at all unsure. We are not under any obligation to update any such material. Any opinion made may be personal to the author and may not reflect the opinion of StoneX Europe Ltd.