



European Open: Evergrande Coughs Up, Flash PMI’s in Focus
Another day, another bullet dodged by the troubled Property Developer Evergrande. With a slight risk-on tone, focus now shifts to Flash PMI data for Europe and the US.
Share this:

Asian Indices:
- Australia's ASX 200 index rose by 3 points (0.04%) and currently trades at 7,418.40
- Japan's Nikkei 225 index has risen by 112.15 points (0.39%) and currently trades at 28,822.41
- Hong Kong's Hang Seng index has risen by 115.37 points (0.44%) and currently trades at 26,132.90
UK and Europe:
- UK's FTSE 100 futures are currently up 25 points (0.35%), the cash market is currently estimated to open at 7,215.30
- Euro STOXX 50 futures are currently up 22 points (0.53%), the cash market is currently estimated to open at 4,177.73
- Germany's DAX futures are currently up 48 points (0.31%), the cash market is currently estimated to open at 15,520.56
US Futures:
- DJI futures are currently down -6.26 points (-0.02%)
- S&P 500 futures are currently down -75.75 points (-0.49%)
- Nasdaq 100 futures are currently down -4.75 points (-0.1%)
Learn how to trade indices
Indices
Evergrande averted another default by transferring funds for a dollar bond, according to a Reuters source. The $83.5 million payment to a trustee account was first reported by a state-backed new outlet earlier today. Whilst this provides relief for some investors the story is far from over with so many ‘known debts’ in the pipeline, alongside however many unknown ‘off balance sheet’ debts lurking in the system for Evergrande and the many Chinese property firms familiar with such practices.
Chinese equity markets led the way higher, although outside of China gains were light. China A50 is on track for a bullish outside week, with the daily chart showing increased bullish momentum. It’s one to watch next week for a break above 16,400, although it may cap as resistance initially due to the 200-day eMA and historical resistance level.
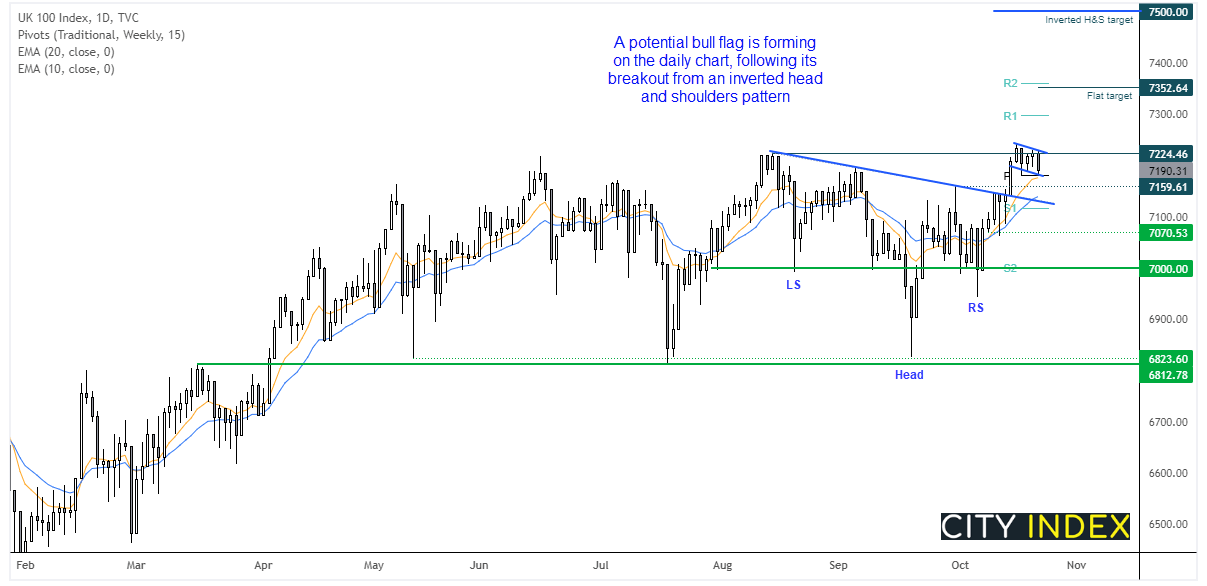

The FTSE 100 remains in a corrective phase following its inverted head and shoulders breakout on the 14th October. It shows the potential for a bull flag breakout on the daily chart, and yesterday’s low found support at the weekly pivot and 10-day eMA. We would therefore be interested in a break above the retracement line (and above yesterday’s high) to suggest momentum has realigned with the H&S breakout.
However, given the two most bearish days in the flag are bearish, we are also on guard for a downside break of yesterday’s low which would brings 7160 support into view.
FTSE 350: Market Internals

FTSE 350: 4119.22 (-0.45%) 21 October 2021
- 133 (37.89%) stocks advanced and 205 (58.40%) declined
- 5 stocks rose to a new 52-week high, 5 fell to new lows
- 56.98% of stocks closed above their 200-day average
- 98.29% of stocks closed above their 50-day average
- 18.23% of stocks closed above their 20-day average
Outperformers:
- + 11.1%-Renishaw PLC(RSW.L)
- + 4.74%-Syncona Ltd(SYNCS.L)
- + 4.22%-Darktrace PLC(DARK.L)
Underperformers:
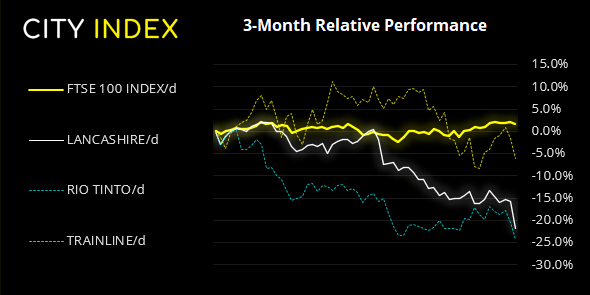
- -7.31%-Lancashire Holdings Ltd(LRE.L)
- -4.84%-Rio Tinto PLC(RIO.L)
- -4.56%-Trainline PLC(TRNT.L)
Forex:
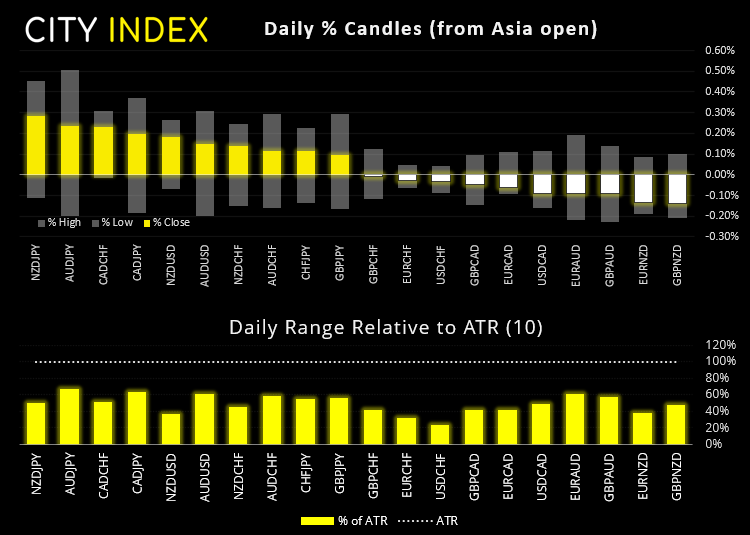
Flash PMI’s are the highlight of today’s economic calendar. Traders like them as they provide a forward look at growth potential, making them one of the preferred leading indictors to trade around.
View today’s video: The Yen Fights Back
Asia has already kicked off and there are some positive signs. Australia’s composite PMI (manufacturing and services combined) expanded at 52.2, up from 46 in September as the services component expanded for the first month in 3. Japan’s manufacturing PMI rose to a 6-month. Separately, rising energy costs saw
- German manufacturing PMI: 56.5 forecast (58.4 prior)
- German Services PMI: 55 forecast (56.2 prior)
- Eurozone manufacturing PMI: 57 forecast (58.6 prior)
- Eurozone Services PMI: 55.5 forecast (58.4 prior)
- UK manufacturing PMI: 55.8 forecast (57.1 prior)
- UK Services PMI: 54.5 forecast (55.4 prior)
- US manufacturing PMI: 60.3 forecast (60.7 prior)
- US Services PMI: 55.1 forecast (54.9 prior)
Take note that retail sales for UK and Canada are also released at
GBP/USD is on track for a 3rd bullish week. 1.3773 is today’s key level for bulls to defend. USD/CAD looks favourable for further upside (should today’s data allow) and perhaps for a run towards yesterday’s high or even the 1.2410 resistance. We suspect the pair has seen a low at 1.2300. USD/JPY is back above 1.14 and is also a preferred pair for bullish setups, should US data come in stronger than expected.
Commodities:
Oil remains a market to watch, given the key reversal days on WTI and Brent. But for that we could do with a stronger US dollar, so hopefully it can find some buyers now the US dollar index has found support above 93.50.
Up Next (Times in BST)
How to trade with City Index
You can trade easily trade with City Index by using these four easy steps:
- Open an account, or log in if you’re already a customer
• Open an account in the UK
• Open an account in Australia
• Open an account in Singapore
- Search for the company you want to trade in our award-winning platform
- Choose your position and size, and your stop and limit levels
- Place the trade
How to trade with FOREX.com
Follow these easy steps to start trading with FOREX.com today:
- Open a Forex.com account, or log in if you’re already a customer.
- Search for the pair you want to trade in our award-winning platform.
- Choose your position and size, and your stop and limit levels.
- Place the trade.



The complete CFD trading experience
Award-winning platforms, competitive spreads, low commissions and dedicated support.
We live and breathe the markets and are dedicated to helping traders realise their ambitions as we continue to set the industry bar.
Economic calendar
Web Trader platform
Our sophisticated web-based platform is packed with features.
Related articles
AUD/USD Bulls Fight Back After Australian Jobs Shock
AUD/USD has been hit by another ugly Australian employment report, sending RBA rate hike expectations sharply lower. Yet the relationships driving the currency have shifted since quarter-end, and improving risk appetite could provide the fuel for a recovery.

Gold Price Short-term Outlook: XAU/USD Holds Critical Support as Breakout Nears 10 15 2026
Gold is consolidating after a steep selloff, with momentum divergence raising the stakes for the next move ahead of the Fed decision.


USD/JPY Update: Can the Japanese Yen Sustain Its Recovery?
Short-term price action around the Japanese yen has started to show some relative improvement over recent sessions. This can be seen in the recent performance of USD/JPY, which has now recorded three consecutive daily declines in favor of the Japanese currency, resulting in a depreciation of roughly 0.35% over the period.

StoneX Europe Ltd may make third party material available on this website which may contain information included but not limited to the conditions of financial markets. The material is for information purposes only and does not contain, and should not be construed as containing, investment advice and/or investment recommendation and/or an investment research and/or an offer of or solicitation for any transactions in financial instruments; any decision to enter into a specific transaction shall be made by the client following an assessment by him/her of their situation.
StoneX Europe Ltd makes no representation or warranty and assumes no liability as to the accuracy or completeness of the information provided, nor any loss arising from any investment based on a recommendation, forecast or other information supplied. You should always seek independent advice as to your suitability to speculate in any related markets and your ability to assume the associated risks, if you are at all unsure. We are not under any obligation to update any such material. Any opinion made may be personal to the author and may not reflect the opinion of StoneX Europe Ltd.