



FOMC Preview: It’s time to taper
Assuming the FOMC decides to taper, the focus will be on the pace of the taper.
Share this:

The markets have been waiting for this meeting for months. Inflation has made “substantial further progress”; that part we know. But has the employment data made substantial further progress? Non-farm Payrolls have averaged 550,000 over the last 3 months. Powell has said that substantial further progress has been “all but met”. September’s Unemployment Rate was 4.8% down from 5.2% in August. Initial Jobless Claims have averaged 299,250 over the last 4 weeks. What is the risk? The risk now is that they DON’T taper! Also, watch for the ever-present possibility of a “Buy the rumor, sell the fact”.
FOMC meeting: What to watch for?
Assuming the FOMC decides to taper, the focus will be on the pace of the taper. The US Federal Reserve is currently buying $80 billion in Treasuries per month and $40 billion of MBS per month. At the press conference after the September meeting, Powell indicated that the tapering of bond purchases should be finished by mid-2022. There has been talk that one of the options may be a reduction of $10 billion in treasuries per month and a reduction of $5 billion in MBS per month. If they began the tapering process in December at that pace, QE would be finished by end of July 2022.
Also, watch for signals as to when they may raise rates afterwards. Powell said that there is a much more stringent criteria for raising rates, as opposed to tapering bond purchases. However, markets are pricing in a rate hike in 1 years’ time. Not coincidentally, markets around the world are pricing in rate hikes ahead of timeframes set forth be central banks. This includes Thursday’s BOE meeting, with a chance of a small hike priced in.
Everything you need to know about the Federal Reserve
In addition, watch for clues as to what inflation will look like moving forward. The Federal Reserve has already indicated that transitory inflation is likely to remain longer than initially thought. However, how much longer? At the end of the day, if you have a long enough timeframe, everything is transitory! Will some of the inflation be “reclassified” as permanent inflation? Watch the statement and press conference for hints regarding future inflation.
Trade USD/JPY now: Login or open a new account!
Market to watch: USD/JPY
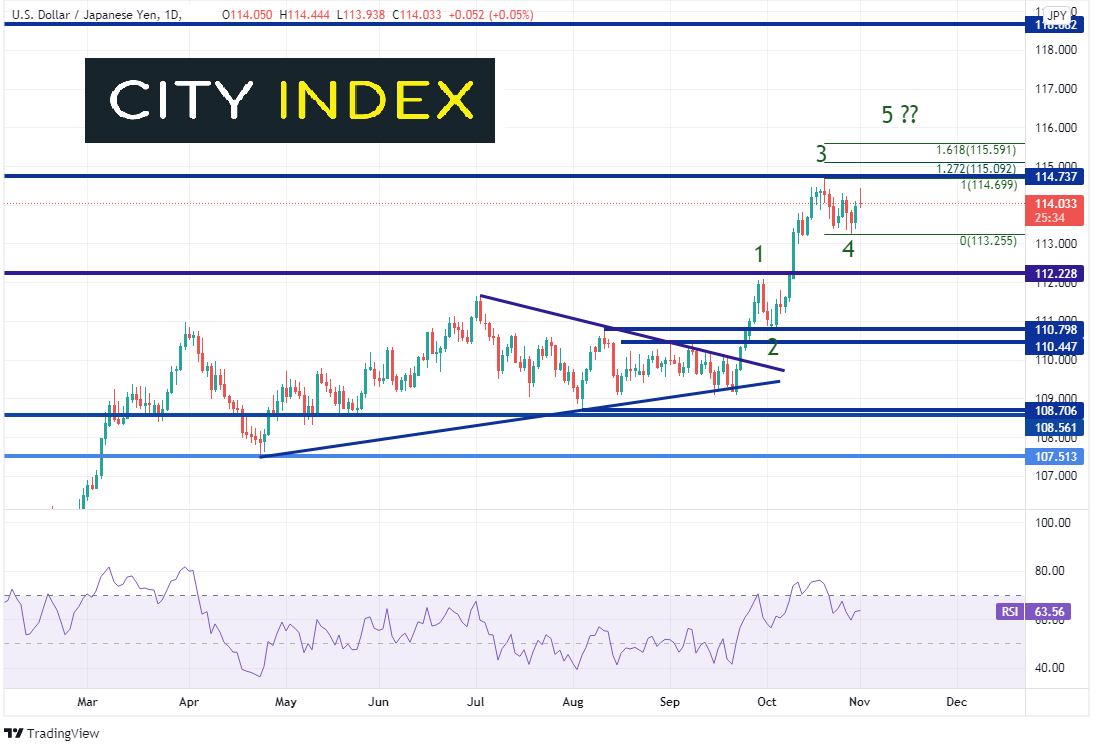
USD/JPY and US yields typically move together. Therefore, if yields are to move higher (particularly the 10-yield), USD/JPY may move there with them. On a daily timeframe, USD/JPY broke higher out of a symmetrical triangle on September 23rd (right after the last FOMC meeting). The pair moved higher in what appears to be an impulsive 1-2-3-4-5 wave of an Elliott Wave cycle. Possible targets for the next wave higher are 115.09 and 115.59. However, USD/JPY must first pass through prior highs at 114.73. The next horizontal resistance isn’t until 118.66! First support is at the Wave 4 lows of 113.25. Below there, price can fall to horizontal support at 112.23.

Source: Tradingview, Stone X
Learn more about forex trading opportunities.
The markets have been waiting for this meeting for months. Inflation has made “substantial further progress”; that part we know. But has the employment data made substantial further progress? Non-farm Payrolls have averaged 550,000 over the last 3 months. Powell has said that substantial further progress has been “all but met”. September’s Unemployment Rate was 4.8% down from 5.2% in August. Initial Jobless Claims have averaged 299,250 over the last 4 weeks. What is the risk? The risk now is that they DON’T taper! Also, watch for the ever-present possibility of a “Buy the rumor, sell the fact”.
Everything you need to know about tapering!
FOMC meeting: What to watch for?
Assuming the FOMC decides to taper, the focus will be on the pace of the taper. The US Federal Reserve is currently buying $80 billion in Treasuries per month and $40 billion of MBS per month. At the press conference after the September meeting, Powell indicated that the tapering of bond purchases should be finished by mid-2022. There has been talk that one of the options may be a reduction of $10 billion in treasuries per month and a reduction of $5 billion in MBS per month. If they began the tapering process in December at that pace, QE would be finished by end of July 2022.
Also, watch for signals as to when they may raise rates afterwards. Powell said that there is a much more stringent criteria for raising rates, as opposed to tapering bond purchases. However, markets are pricing in a rate hike in 1 years’ time. Not coincidentally, markets around the world are pricing in rate hikes ahead of timeframes set forth be central banks. This includes Thursday’s BOE meeting, with a chance of a small hike priced in.
Everything you need to know about the Federal Reserve
In addition, watch for clues as to what inflation will look like moving forward. The Federal Reserve has already indicated that transitory inflation is likely to remain longer than initially thought. However, how much longer? At the end of the day, if you have a long enough timeframe, everything is transitory! Will some of the inflation be “reclassified” as permanent inflation? Watch the statement and press conference for hints regarding future inflation.
Trade USD/JPY now: Login or Open a new account!
• Open an account in the UK
• Open an account in Australia
• Open an account in Singapore
Market to watch: USD/JPY
USD/JPY and US yields typically move together. Therefore, if yields are to move higher (particularly the 10-yield), USD/JPY may move there with them. On a daily timeframe, USD/JPY broke higher out of a symmetrical triangle on September 23rd (right after the last FOMC meeting). The pair moved higher in what appears to be an impulsive 1-2-3-4-5 wave of an Elliott Wave cycle. Possible targets for the next wave higher are 115.09 and 115.59. However, USD/JPY must first pass through prior highs at 114.73. The next horizontal resistance isn’t until 118.66! First support is at the Wave 4 lows of 113.25. Below there, price can fall to horizontal support at 112.23.
Source: Tradingview, Stone X
Learn more about forex trading opportunities.
Related tags:
Latest market news




The complete CFD trading experience
Award-winning platforms, competitive spreads, low commissions and dedicated support.
We live and breathe the markets and are dedicated to helping traders realise their ambitions as we continue to set the industry bar.
Economic calendar
Web Trader platform
Our sophisticated web-based platform is packed with features.
Related articles
USD/JPY outlook: Hawkish Fed recalibration pressures the yen
Stronger US growth momentum and rising Treasury yields are keeping USD/JPY pointed higher, even as Japanese policymakers try to limit the pressure building across domestic markets.
Gold, silver slammed as hawkish Fed repricing reignites dollar upside
Gold and silver had held up surprisingly well against surging US yields. Wednesday’s DXY breakout may have changed that equation.
USD/MXN Forecast: Peso Loses Momentum Ahead of Banxico Decision
Over recent trading sessions, the Mexican peso has started to show signs of losing strength against the U.S. dollar. This can be seen in the performance of USD/MXN, which has gained more than 1.7% over the last three sessions, highlighting the dollar's renewed strength against the peso.

StoneX Europe Ltd may make third party material available on this website which may contain information included but not limited to the conditions of financial markets. The material is for information purposes only and does not contain, and should not be construed as containing, investment advice and/or investment recommendation and/or an investment research and/or an offer of or solicitation for any transactions in financial instruments; any decision to enter into a specific transaction shall be made by the client following an assessment by him/her of their situation.
StoneX Europe Ltd makes no representation or warranty and assumes no liability as to the accuracy or completeness of the information provided, nor any loss arising from any investment based on a recommendation, forecast or other information supplied. You should always seek independent advice as to your suitability to speculate in any related markets and your ability to assume the associated risks, if you are at all unsure. We are not under any obligation to update any such material. Any opinion made may be personal to the author and may not reflect the opinion of StoneX Europe Ltd.