



Global Indices: January ‘down’, 11-months to go
Global equity markets were mostly lower in January. But even the few that posted gains had to endure a white-knuckle ride along the way.
Share this:

January did not deliver the returns many had hoped. Red-hot inflation prints, a hawkish Fed and rising tensions between Russia and Ukraine proved too much for equity bulls and saw investors flock towards the exit. Yet the truth of the matter is that much of this selling began late December during low-volume trade, only to see economic data and headlines trigger the next round of selling mid-January.
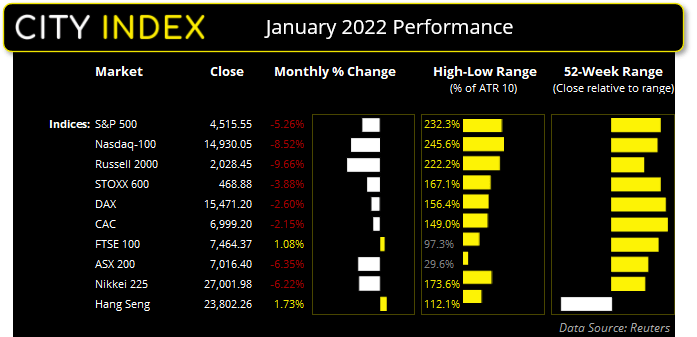

Technology stocks led the decline with the Nasdaq 100 facing its worst January since 2008. It was the first major benchmark to enter an official correction of -10%, and it has fallen over -18% from its record high in November to this month’s low. The S&P 500 fell -5.25% in January, although it initially fell -12.4% from its January high before a late-month recovery.
Europe didn’t fare so badly as their US counterparts, as prospects of the Fed tightening alongside a dovish ECB provided a less bearish narrative. It could be argued that geopolitical tensions surrounding Russia played the better part in forcing the STOXX 600 nearly -4% lower in January, compared to just -2.6% for the DAX.
And that leaves the January outperformer as the Hang Seng. A slew of weak economic data from China alongside easing measures from PBOC (People’s Bank of China) helped the Hang Seng shake off much of the bearish volatility. In fact, it is one of the few indices to have closed higher by around +1.7% in January. With that all said, it is interesting to note how Wall Street bounced on the last day of January which makes us question whether we have seen the corrective lows, or it is simply part of a dead-cat bounce.
Nasdaq 100
The Nasdaq 100 found support just above a 161.8% Fibonacci projection on January 24th. The January lows also coincide with a 38.2% Fibonacci retracement ratio and prices have since rallied out of a choppy, sideways congestion zone. RSI (14) is no longer oversold and a bullish divergence formed on the Stochastic oscillator. We therefore expect the market could trade higher from here, although we also need to see prices break above the 200-day MA (moving average) and the 15,000 level before assuming further gains.


Nikkei 225
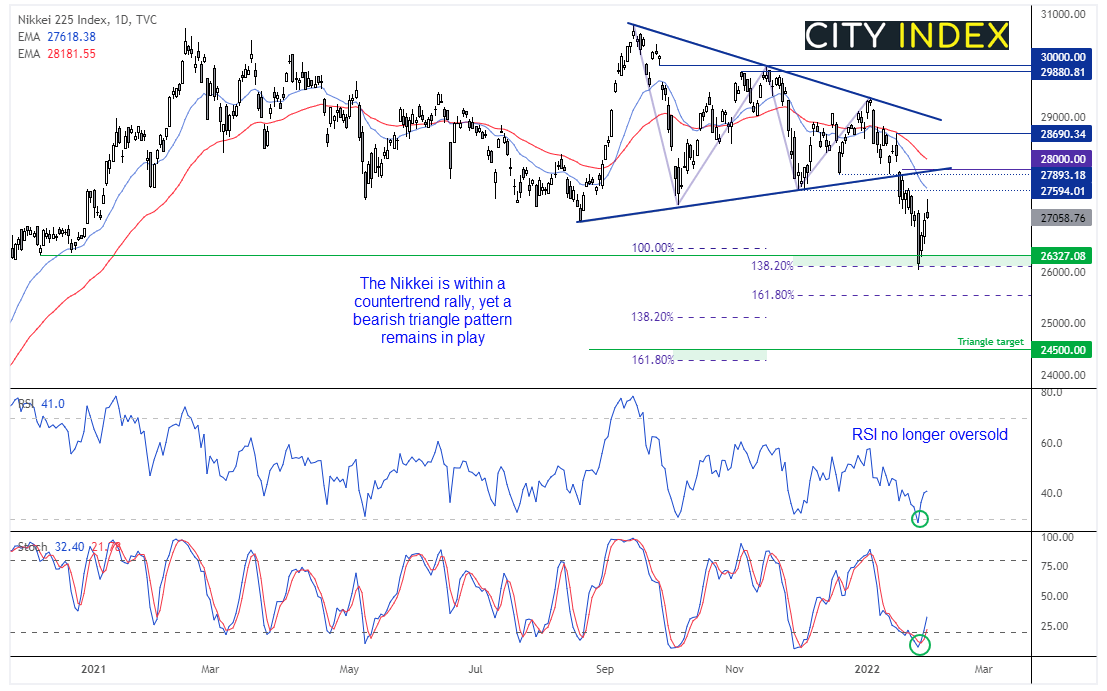
If the Nasdaq continues to bounce is could also provide further tailwinds for the Nikkei 225, due to the large proportion of technology stocks in Japan’s prime index. The RSI (14) has also rose with prices and out of the ‘oversold’ zone of 30 and the stochastic oscillator generated a buy signal. However, price action overall retains a bearish structure as it broke out of a bearish triangle on January 19th. If successful the triangle targets the area around 24,500, near a 161.8% Fibonacci level. Whilst the jury remains out as to whether the Nasdaq can trade back to its all-time highs, we continue to suspect the upside potential for the Nikkei is limited and are seeking bearish setups around key resistance levels.
Read our guide on the Nikkei 225 trading guide
Read our guide on the Nikkei 225 trading guide

How to trade with City Index
You can easily trade with City Index by using these four easy steps:
- Open an account, or log in if you’re already a customer
• Open an account in the UK
• Open an account in Australia
• Open an account in Singapore
- Search for the company you want to trade in our award-winning platform
- Choose your position and size, and your stop and limit levels
- Place the trade
How to trade with FOREX.com
Follow these easy steps to start trading with FOREX.com today:
- Open a Forex.com account, or log in if you’re already a customer.
- Search for the pair you want to trade in our award-winning platform.
- Choose your position and size, and your stop and limit levels.
- Place the trade.
Related tags:
Latest market news




The complete CFD trading experience
Award-winning platforms, competitive spreads, low commissions and dedicated support.
We live and breathe the markets and are dedicated to helping traders realise their ambitions as we continue to set the industry bar.
Economic calendar
Web Trader platform
Our sophisticated web-based platform is packed with features.
Related articles
Gold outlook: XAU/USD hammered, stretched and vulnerable to a sharp rebound
Gold is getting hammered for solid fundamental reasons, but history suggests extreme four-hourly oversold conditions can produce violent countertrend rallies.
EUR/USD, USD/JPY Outlook: Oil, yields and an FX identity crisis
Crude oil is setting the tone across rates and FX, leaving EUR/USD vulnerable and USD/JPY caught between higher Treasury yields and the growing threat of intervention
Gold forecast: Rising yields become too hot for gold, but the outlook is far from bearish
Gold and silver prices took a plunge today, with the former down 3% and the latter falling some 5% by mid European session, before bouncing off their lows. The losses come after the metals remained largely supported until last week, despite the big dollar rally and surging bond yields as we have seen in recent weeks. But it simply got too much, and the metals succumbed to pressure today.

StoneX Europe Ltd may make third party material available on this website which may contain information included but not limited to the conditions of financial markets. The material is for information purposes only and does not contain, and should not be construed as containing, investment advice and/or investment recommendation and/or an investment research and/or an offer of or solicitation for any transactions in financial instruments; any decision to enter into a specific transaction shall be made by the client following an assessment by him/her of their situation.
StoneX Europe Ltd makes no representation or warranty and assumes no liability as to the accuracy or completeness of the information provided, nor any loss arising from any investment based on a recommendation, forecast or other information supplied. You should always seek independent advice as to your suitability to speculate in any related markets and your ability to assume the associated risks, if you are at all unsure. We are not under any obligation to update any such material. Any opinion made may be personal to the author and may not reflect the opinion of StoneX Europe Ltd.