



Gold, Bitcoin Outlook: Testing Key Resistance as WTI Cools on Trump Comments
Gold, Bitcoin Outlook: Gold and Bitcoin test major resistance levels as WTI crude oil cools following Trump’s Middle East comments. Key levels on DXY, gold, and BTC may confirm the next structural market shift.
Share this:

Key Events
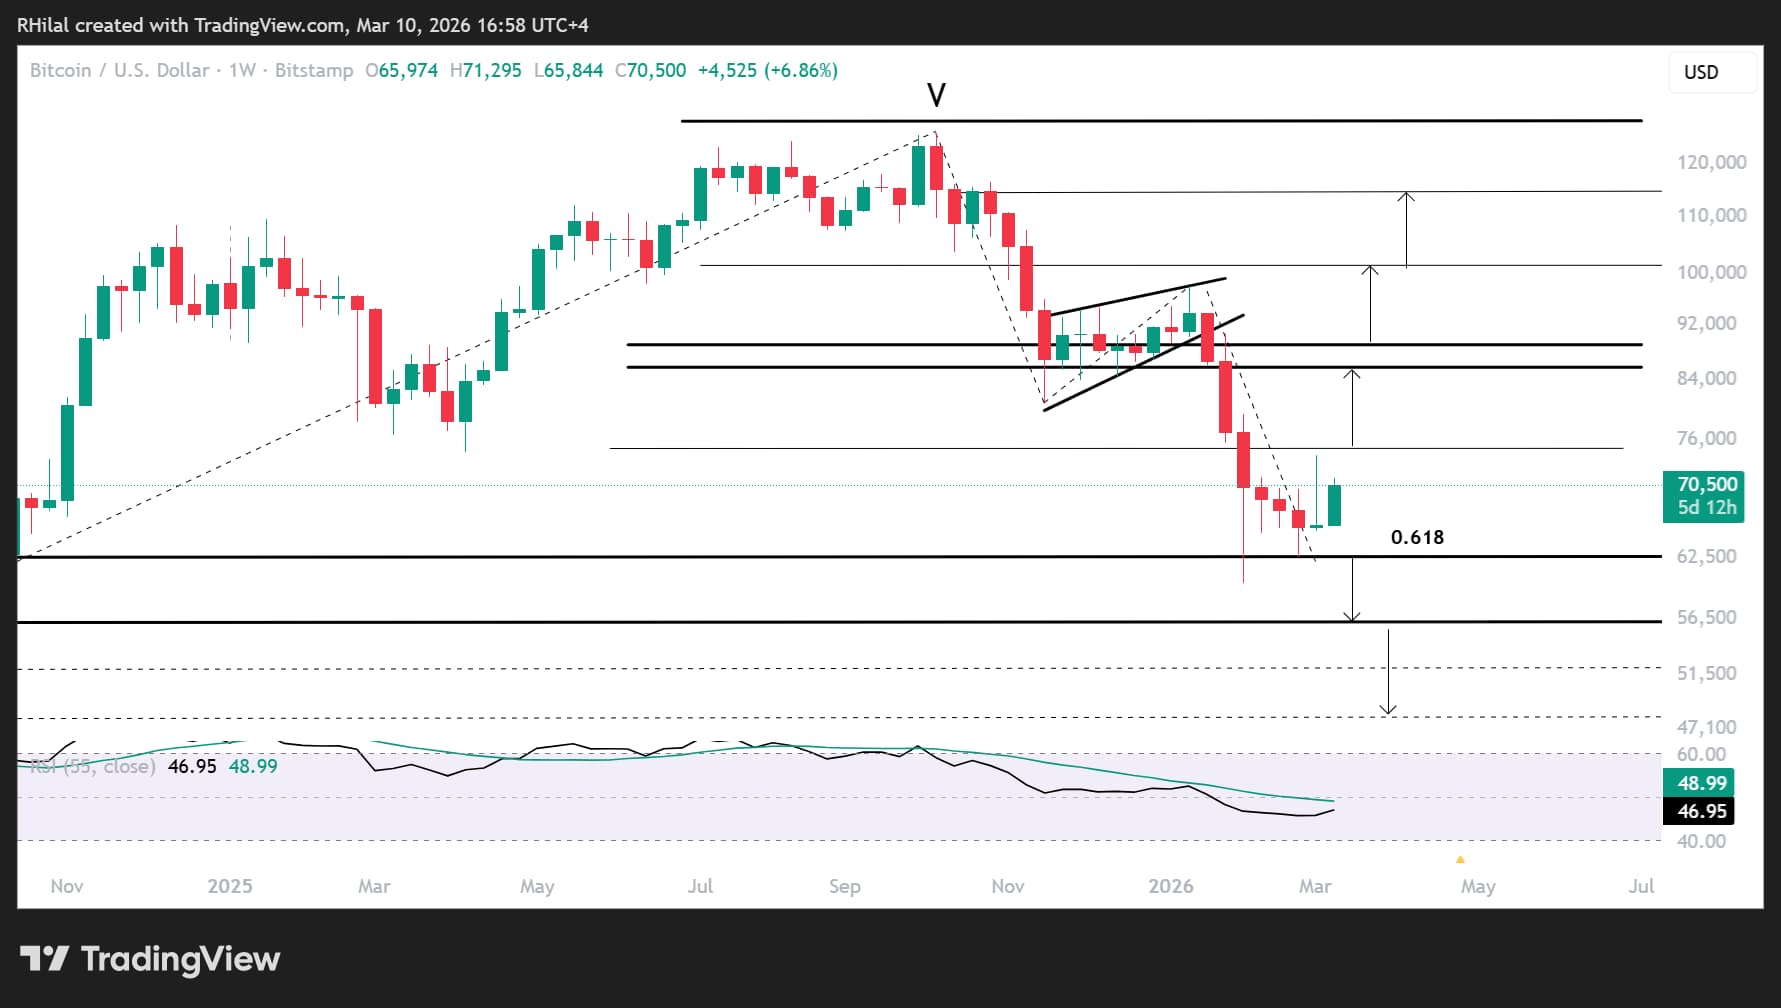
- Trump’s latest comments, foreseeing a near-term resolution to the Middle East conflict, re-injected bullish sentiment into markets, lifting Bitcoin toward the 75,000 resistance and gold toward the 5,200 resistance.
- WTI crude oil is winding down after Trump signaled that prices above $100 per barrel may not be sustainable. This has supported positive sentiment, given the implications for global inflation expectations and interest rate decisions.
- US CPI is due Wednesday. The report is unlikely to reflect Middle East conflict risks or carry as much market impact as developments surrounding the Strait of Hormuz.
Intermarket Chain Reaction Still Intact
The broader intermarket chain remains solid. Middle East oil supply risks, from storage facility threats to Strait of Hormuz disruptions, have been lifting crude prices, inflation expectations, and the US Dollar.
However, key markets including the DXY, gold, Bitcoin, and Nasdaq are now challenging major long-term levels that could confirm whether a structural breakout is developing.
Key Levels to Watch
- DXY: 99.50
- Nasdaq: 25,200 – 25,800
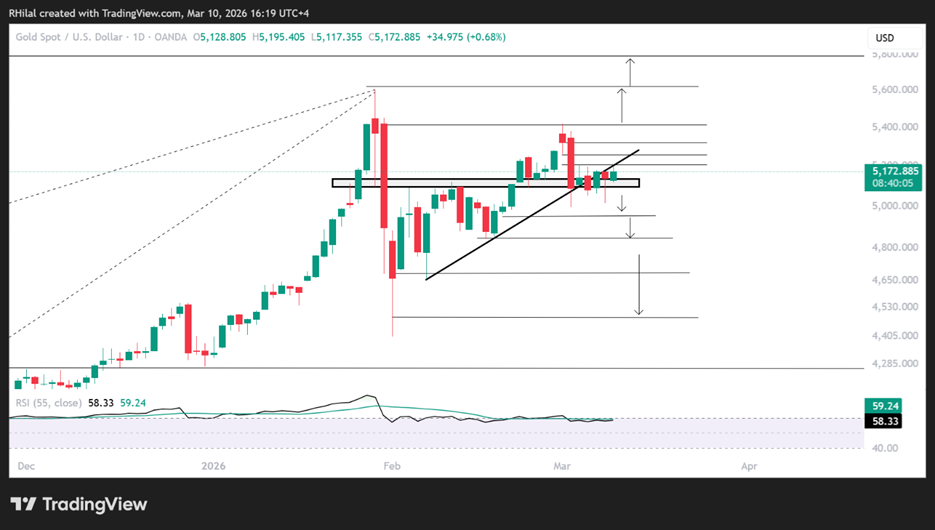
- Gold: 5,200
- Bitcoin: 75,000 – 80,000

A sustained break above 99.50 in the dollar would confirm renewed inflation expectations, potentially dampening global risk sentiment and rate-cut expectations.
Meanwhile, a breakout above resistance in gold, Nasdaq, and Bitcoin would reflect dollar weakness and a broader return to risk-on sentiment.
Bitcoin Outlook: Weekly Time Frame – Log Scale
Source: Trading view
Bitcoin’s technical structure remains intact, with price action holding a rebound above the 60,000 support.
The significance of this support lies in its alignment with:
- The 0.618 Fibonacci retracement of the 2022–2025 uptrend
- Former resistance connecting the 2021 highs
- The full measured target of the bearish wedge formed between November 2024 and January 2026
If price action sustains a breakout above the 75,000–80,000 resistance zone, bullish momentum could resume toward 90,000, 100,000, and 130,000, before exposing the 150,000 and 200,000 thresholds, particularly if supported by favorable global regulatory developments.
On the downside, a weekly close below 60,000 exposes 56,000 and 48,000, which may present strategic dip-buying opportunities.
Gold Outlook: Weekly Time Frame – Log Scale
Source: Trading view
Gold remains in consolidation, trading beyond the trendline connecting higher lows since February 2026. The bias leans neutral-to-bearish below the 5,200 resistance and above the 4,960 support.
A weekly close above 5,200 exposes: 5,250 - 5,320 - 5,400 - 5,600 - 6,000
On the downside, a close below 4,960 exposes a deeper correction toward: 4,840 - 4,680 - 4,480
These represent approximately 200-point declines between previously respected support zones. A break below the February 2026 lows could expose a further 1,000-point correction, resetting momentum before realigning the metal with potential new record highs.
Written by Razan Hilal, CMT
Follow on X: @Rh_waves
Latest market news




The complete CFD trading experience
Award-winning platforms, competitive spreads, low commissions and dedicated support.
We live and breathe the markets and are dedicated to helping traders realise their ambitions as we continue to set the industry bar.
Economic calendar
Web Trader platform
Our sophisticated web-based platform is packed with features.
Related articles
Gold Forecast: Are Bears Regaining Control of XAU/USD?
The start of the trading week has not been particularly favorable for gold. This can be seen in recent XAU/USD price action, with the metal falling nearly 4.00% over the last two trading sessions and bringing renewed attention to a bearish bias within the market.


Gold outlook: XAU/USD hammered, stretched and vulnerable to a sharp rebound
Gold is getting hammered for solid fundamental reasons, but history suggests extreme four-hourly oversold conditions can produce violent countertrend rallies.


Gold forecast: Rising yields become too hot for gold, but the outlook is far from bearish
Gold and silver prices took a plunge today, with the former down 3% and the latter falling some 5% by mid European session, before bouncing off their lows. The losses come after the metals remained largely supported until last week, despite the big dollar rally and surging bond yields as we have seen in recent weeks. But it simply got too much, and the metals succumbed to pressure today.

StoneX Europe Ltd may make third party material available on this website which may contain information included but not limited to the conditions of financial markets. The material is for information purposes only and does not contain, and should not be construed as containing, investment advice and/or investment recommendation and/or an investment research and/or an offer of or solicitation for any transactions in financial instruments; any decision to enter into a specific transaction shall be made by the client following an assessment by him/her of their situation.
StoneX Europe Ltd makes no representation or warranty and assumes no liability as to the accuracy or completeness of the information provided, nor any loss arising from any investment based on a recommendation, forecast or other information supplied. You should always seek independent advice as to your suitability to speculate in any related markets and your ability to assume the associated risks, if you are at all unsure. We are not under any obligation to update any such material. Any opinion made may be personal to the author and may not reflect the opinion of StoneX Europe Ltd.