



Gold bull flagging
Following the burst of momentum in the summer months, gold has endured a rather ugly – if still volatile – couple of months in September and October.
Share this:

Following the burst of momentum in the summer months, gold has endured a rather ugly – if still volatile – couple of months in September and October. In part, the recent struggles can be explained away by increased optimism that the US-China trade situation and Brexit stalemate could soon be over, reducing safe-haven demand. In addition, you have profit-taking from overbought levels also applying a bit of downward pressure. All told however, with central banks still in easing mode and geopolitical risks remaining elevated, the long-term outlook remains positive for the commodity.
Indeed, even if the US-China were to end their trade war, this won’t necessarily be a bad thing, as the prospects of raised physical demand from one of, if not the, largest gold consumer nations may keep prices support. In fact, investor interest in gold has already been rising steadily over the past few months. According to the World Gold Council, global gold-backed ETFs and similar products had $3.9bn of net inflows across all regions in September. This meant, collective gold holdings increased to 2,808 tonnes, the highest of all time, thus surpassing the late 2012 levels, when gold was trading near $1,700. If ETF holdings are anything to go by, then gold could rise at least another $200 from current levels. But obviously it is not as simple as that, as the other variables impacting prices now are different to those in 2012.
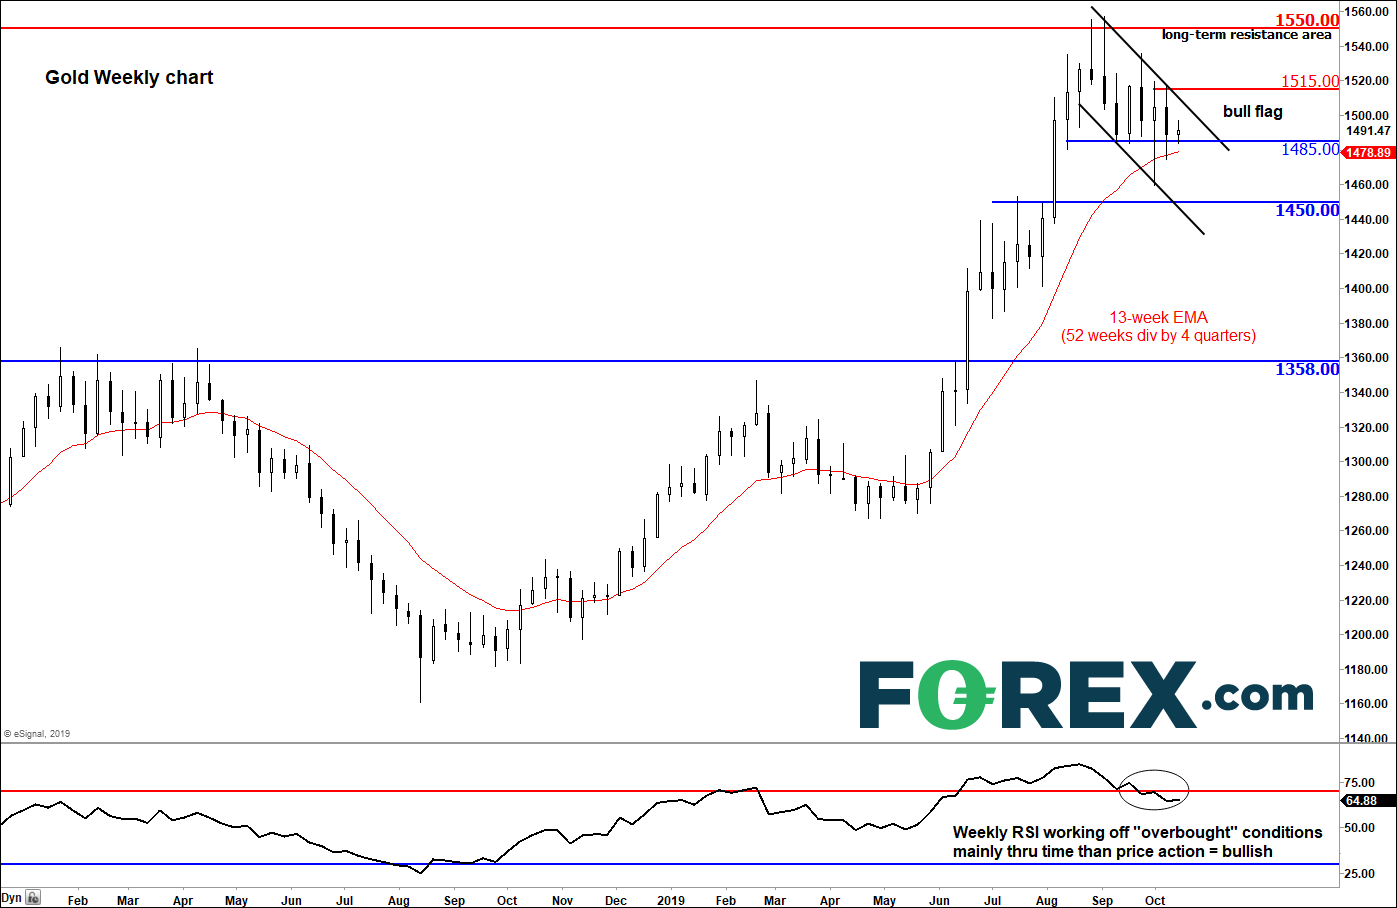
From a technical point of view, gold’s sharp gains in the middle of this year undoubtedly caused prices to become overbought. But now we are seeing the longer-term momentum oscillators such as the Relative Strength Index (RSI) on the weekly chart slowly work off their overbought conditions, crucially through time rather than price action. This is a good sign as it indicates gold is holding near the highs without giving back much. With the RSI no longer being overbought on the weekly time frame, the long-term uptrend could soon resume. The precious metal is currently stuck inside a bull flag pattern. It is likely that we will see fresh technical momentum buying should prices beak out of this bullish continuation pattern in the coming days or weeks. But before the breakout can potentially occur, we can’t rule out the prospects of further short-term pain for the bulls. The point of breakout is around $1510-20. So, while it remains below here, we are neutral. If and when gold breaks above here, then we will turn bullish.
Indeed, the long-term momentum has been bullish for gold. Although the metal fell in September, it is currently holding in the positive territory so far this month. Prior to September’s drop, gold had:
- rallied for 4 consecutive months,
- risen for 8 out of the past 12 months,
- broken out of a 6-year old consolidation, and
- taken out numerous resistance levels and moving averages.
So, due to the above reasons, we favour looking for bullish rather than bearish price patterns to emerge going forward. That said, the bulls must show up and soon, before we reinstate our bullish view.

Source: eSignal and City Index.
Following the burst of momentum in the summer months, gold has endured a rather ugly – if still volatile – couple of months in September and October. In part, the recent struggles can be explained away by increased optimism that the US-China trade situation and Brexit stalemate could soon be over, reducing safe-haven demand. In addition, you have profit-taking from overbought levels also applying a bit of downward pressure. All told however, with central banks still in easing mode and geopolitical risks remaining elevated, the long-term outlook remains positive for the commodity.
Indeed, even if the US-China were to end their trade war, this won’t necessarily be a bad thing, as the prospects of raised physical demand from one of, if not the, largest gold consumer nations may keep prices support. In fact, investor interest in gold has already been rising steadily over the past few months. According to the World Gold Council, global gold-backed ETFs and similar products had $3.9bn of net inflows across all regions in September. This meant, collective gold holdings increased to 2,808 tonnes, the highest of all time, thus surpassing the late 2012 levels, when gold was trading near $1,700. If ETF holdings are anything to go by, then gold could rise at least another $200 from current levels. But obviously it is not as simple as that, as the other variables impacting prices now are different to those in 2012.
From a technical point of view, gold’s sharp gains in the middle of this year undoubtedly caused prices to become overbought. But now we are seeing the longer-term momentum oscillators such as the Relative Strength Index (RSI) on the weekly chart slowly work off their overbought conditions, crucially through time rather than price action. This is a good sign as it indicates gold is holding near the highs without giving back much. With the RSI no longer being overbought on the weekly time frame, the long-term uptrend could soon resume. The precious metal is currently stuck inside a bull flag pattern. It is likely that we will see fresh technical momentum buying should prices beak out of this bullish continuation pattern in the coming days or weeks. But before the breakout can potentially occur, we can’t rule out the prospects of further short-term pain for the bulls. The point of breakout is around $1510-20. So, while it remains below here, we are neutral. If and when gold breaks above here, then we will turn bullish.
Indeed, the long-term momentum has been bullish for gold. Although the metal fell in September, it is currently holding in the positive territory so far this month. Prior to September’s drop, gold had:
- rallied for 4 consecutive months,
- risen for 8 out of the past 12 months,
- broken out of a 6-year old consolidation, and
- taken out numerous resistance levels and moving averages.
So, due to the above reasons, we favour looking for bullish rather than bearish price patterns to emerge going forward. That said, the bulls must show up and soon, before we reinstate our bullish view.
Source: eSignal and FOREX.com.
Related tags:
Latest market news




The complete CFD trading experience
Award-winning platforms, competitive spreads, low commissions and dedicated support.
We live and breathe the markets and are dedicated to helping traders realise their ambitions as we continue to set the industry bar.
Economic calendar
Web Trader platform
Our sophisticated web-based platform is packed with features.
Related articles

EUR/USD, Gold Forecast: Two trades to watch
EUR/USD falls to a 2-month low despite Eurozone growth picking up. Gold under pressure as a stronger USD offsets falling oil prices.


Gold forecast: XAU/USD caught between conflicting forces
Gold has started the new week on the back foot after ending a three-week losing streak with gains over the final two sessions of last week. The rebound came as the dollar’s rally stalled and oil prices retreated, while a broader improvement in risk appetite lifted major equity indices and extended Bitcoin’s recovery to $85,000. For now, consolidation is the name of the game, but if the US dollar, bond yields or oil prices start moving higher again then this will negatively impact the price of gold.


Gold, silver shrug off a brutal macro stress test
A hawkish Fed, surging short-dated Treasury yields and a firmer dollar failed to deliver the kind of damage usually seen in precious metals.

StoneX Europe Ltd may make third party material available on this website which may contain information included but not limited to the conditions of financial markets. The material is for information purposes only and does not contain, and should not be construed as containing, investment advice and/or investment recommendation and/or an investment research and/or an offer of or solicitation for any transactions in financial instruments; any decision to enter into a specific transaction shall be made by the client following an assessment by him/her of their situation.
StoneX Europe Ltd makes no representation or warranty and assumes no liability as to the accuracy or completeness of the information provided, nor any loss arising from any investment based on a recommendation, forecast or other information supplied. You should always seek independent advice as to your suitability to speculate in any related markets and your ability to assume the associated risks, if you are at all unsure. We are not under any obligation to update any such material. Any opinion made may be personal to the author and may not reflect the opinion of StoneX Europe Ltd.