



Gold Prices Dragged by Lower Demand
The World Gold Council reported that Q3 gold demand dropped to the lowest level since Q3 2009...
Share this:

On Friday, spot gold ended 0.6% higher to $1,879, though still marking a third straight month of decline, as the U.S. dollar began to gain strength. Over the weekend, the World Gold Council reported that Q3 gold demand dropped 19% on year to 892 tons, the lowest level since Q3 2009. Demand was 10% lower at 2,972 tons in the first nine months of the year, compared with the prior-year period.
Gold demand in China was mixed. The report highlighted that Q3 jewellery demand slid 29% on year to 333 tons, where China and India accounted for the largest volume declines, citing the COVID-19 effects. By contrast, bar and coin investment jumped 49% on year to 222 tons, as most major retail investment markets saw strong growth though the largest volume increases were seen in Western markets, China and Turkey.
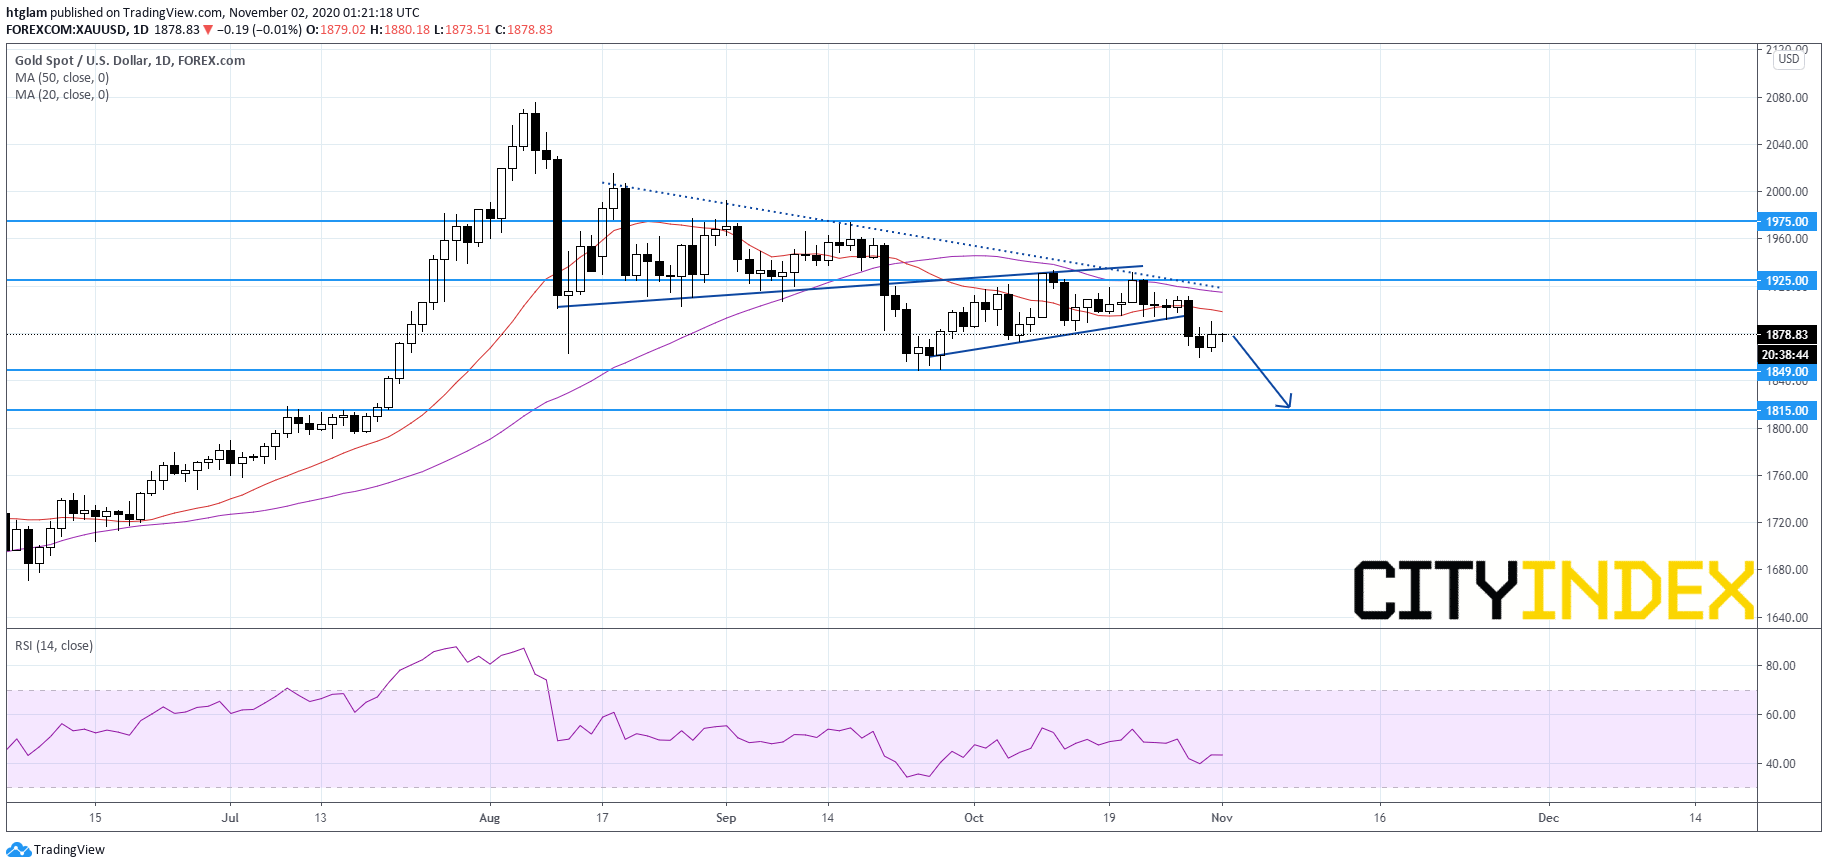
From a technical point of view, spot gold stays on the downside as shown on the daily chart. It remains capped by a declining trend line drawn from August, with a shorter-term bullish trend line broken. The level at $1,925 might be considered as the nearest resistance, while the 1st and 2nd support are expected to be located at $1,849 and $1,815 respectively.
Source: Gain Capital, TradingView
On Friday, spot gold ended 0.6% higher to $1,879, though still marking a third straight month of decline, as the U.S. dollar began to gain strength. Over the weekend, the World Gold Council reported that Q3 gold demand dropped 19% on year to 892 tons, the lowest level since Q3 2009. Demand was 10% lower at 2,972 tons in the first nine months of the year, compared with the prior-year period.
Gold demand in China was mixed. The report highlighted that Q3 jewellery demand slid 29% on year to 333 tons, where China and India accounted for the largest volume declines, citing the COVID-19 effects. By contrast, bar and coin investment jumped 49% on year to 222 tons, as most major retail investment markets saw strong growth though the largest volume increases were seen in Western markets, China and Turkey.
From a technical point of view, spot gold stays on the downside as shown on the daily chart. It remains capped by a declining trend line drawn from August, with a shorter-term bullish trend line broken. The level at $1,925 might be considered as the nearest resistance, while the 1st and 2nd support are expected to be located at $1,849 and $1,815 respectively.

Source: Gain Capital, TradingView
Related tags:
Latest market news




The complete CFD trading experience
Award-winning platforms, competitive spreads, low commissions and dedicated support.
We live and breathe the markets and are dedicated to helping traders realise their ambitions as we continue to set the industry bar.
Economic calendar
Web Trader platform
Our sophisticated web-based platform is packed with features.
Related articles

Gold outlook: XAU/USD hammered, stretched and vulnerable to a sharp rebound
Gold is getting hammered for solid fundamental reasons, but history suggests extreme four-hourly oversold conditions can produce violent countertrend rallies.


Gold forecast: Rising yields become too hot for gold, but the outlook is far from bearish
Gold and silver prices took a plunge today, with the former down 3% and the latter falling some 5% by mid European session, before bouncing off their lows. The losses come after the metals remained largely supported until last week, despite the big dollar rally and surging bond yields as we have seen in recent weeks. But it simply got too much, and the metals succumbed to pressure today.


Gold Dips Below Three-Month Uptrend, Bitcoin Pulls Back from Nine-Month High
Gold has dipped below its three-month uptrend, while Bitcoin has pulled back from a nine-month high as U.S. bond yields test levels last seen in 2004 and 2007. Risks build as Fed rate-hike expectations remain above 70%, while the Dollar Index holds near yearly highs.

StoneX Europe Ltd may make third party material available on this website which may contain information included but not limited to the conditions of financial markets. The material is for information purposes only and does not contain, and should not be construed as containing, investment advice and/or investment recommendation and/or an investment research and/or an offer of or solicitation for any transactions in financial instruments; any decision to enter into a specific transaction shall be made by the client following an assessment by him/her of their situation.
StoneX Europe Ltd makes no representation or warranty and assumes no liability as to the accuracy or completeness of the information provided, nor any loss arising from any investment based on a recommendation, forecast or other information supplied. You should always seek independent advice as to your suitability to speculate in any related markets and your ability to assume the associated risks, if you are at all unsure. We are not under any obligation to update any such material. Any opinion made may be personal to the author and may not reflect the opinion of StoneX Europe Ltd.