




Index in focus: DJIA (US 30) coiling below key resistance
This week’s tight range signals a fine balance between buyers and sellers, but the short-term momentum still remains with the bulls...
Share this:

Since bottoming just over a month ago, major US indices have staged a furious bounce to their highest levels since September. Surprisingly for some traders, this rally has been led by the stodgy Dow Jones Industrial Average (+19% trough-to-peak rally), rather than the broader S&P 500 (+15%) or the previously high-flying Nasdaq 100 index of technology stocks (+14%).
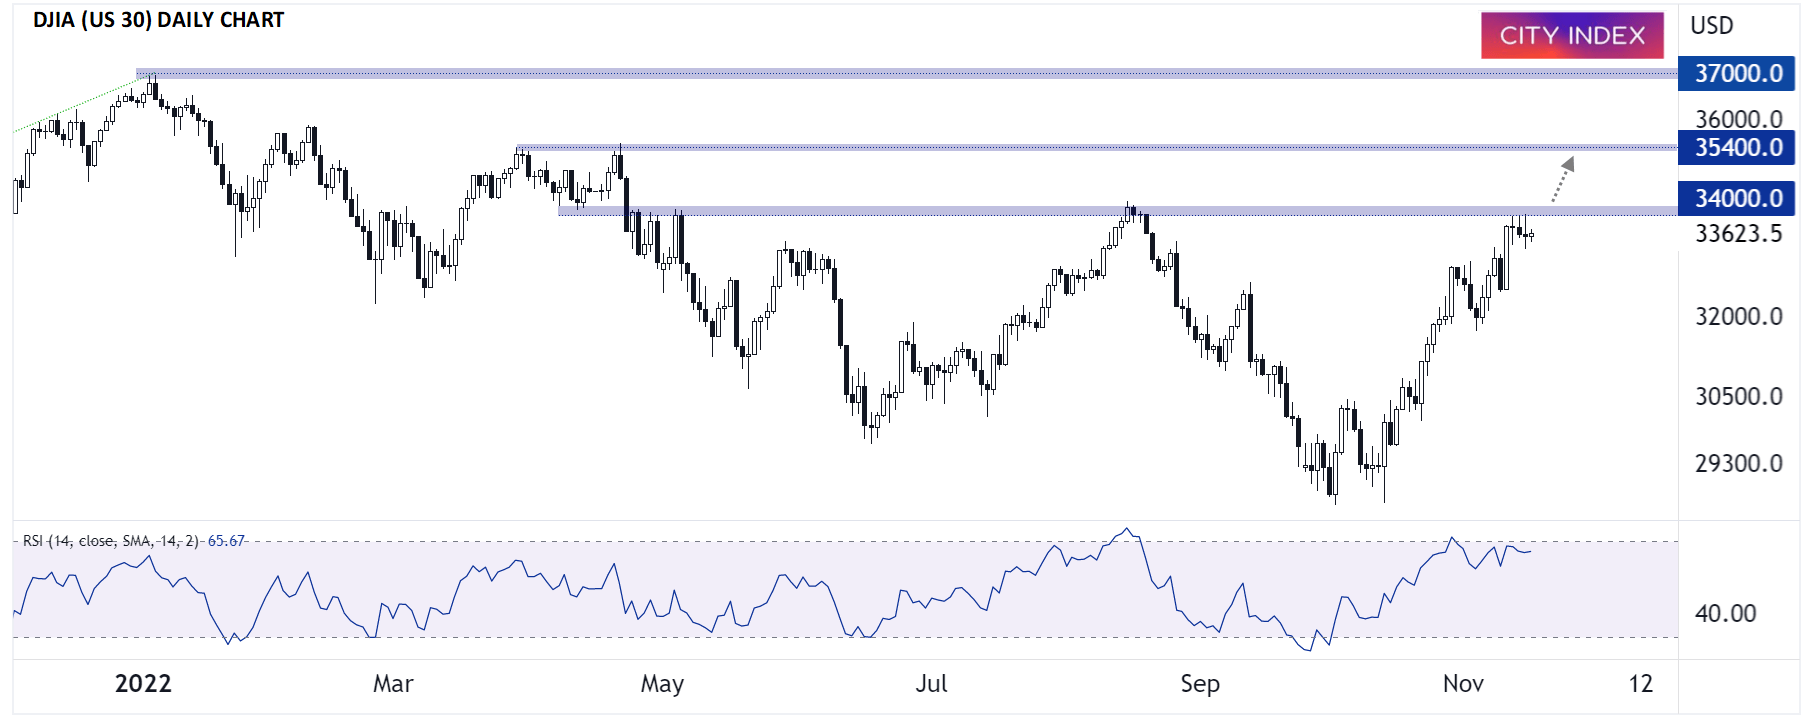
As the chart below shows, the DJIA (US 30) has spent this week coiling just below key resistance around 34,000. After a big rally into resistance, this week’s tight range signals a fine balance between buyers and sellers, but the short-term momentum still remains with the bulls, so if prices can break and close conclusively above 34,000, a bullish continuation toward the March/April highs in the mid-35,000s may be next.
Source: TradingView, StoneX
In terms of fundamental catalysts, we’re nearing the end of a mediocre-but-still-better-than-expected Q3 earnings season for US stocks, so traders are likely to shift their focus to macroeconomic data heading into the holidays. Specifically, the more timely, on-the-ground style of reports – including the regional Fed indices and PMI readings – will be worth watching for early signs that the US economy may be heading into a recession. Of course, the top-tier reports for the rest of the year will be inflation data (CPI and Core PCE), as well as the Fed’s hotly-anticipated monetary policy meeting in mid-December.
After months of “bad (economic) news is good news (for the stock market),” we may be nearing an inflection point as we approach peak Fed Funds rates around 5%. Now, instead of worrying what economic data may mean for the Fed, which appears set to gradually slow rate hikes over the next few months, traders will key in on what it means for underlying US economy and the potential for a recession in 2023.
In that vein, DJIA bulls would prefer to see strong economic data to support a continued rally to 35,000 or beyond in the index.
How to trade with FOREX.com
Follow these easy steps to start trading with FOREX.com today:
- Open a Forex.com account, or log-in if you’re already a customer.
- Search for the pair you want to trade in our award-winning platform.
- Choose your position and size, and your stop and limit levels.
- Place the trade.
Since bottoming just over a month ago, major US indices have staged a furious bounce to their highest levels since September. Surprisingly for some traders, this rally has been led by the stodgy Dow Jones Industrial Average (+19% trough-to-peak rally), rather than the broader S&P 500 (+15%) or the previously high-flying Nasdaq 100 index of technology stocks (+14%).
As the chart below shows, the DJIA (US 30) has spent this week coiling just below key resistance around 34,000. After a big rally into resistance, this week’s tight range signals a fine balance between buyers and sellers, but the short-term momentum still remains with the bulls, so if prices can break and close conclusively above 34,000, a bullish continuation toward the March/April highs in the mid-35,000s may be next.
Source: TradingView, StoneX
In terms of fundamental catalysts, we’re nearing the end of a mediocre-but-still-better-than-expected Q3 earnings season for US stocks, so traders are likely to shift their focus to macroeconomic data heading into the holidays. Specifically, the more timely, on-the-ground style of reports – including the regional Fed indices and PMI readings – will be worth watching for early signs that the US economy may be heading into a recession. Of course, the top-tier reports for the rest of the year will be inflation data (CPI and Core PCE), as well as the Fed’s hotly-anticipated monetary policy meeting in mid-December.
After months of “bad (economic) news is good news (for the stock market),” we may be nearing an inflection point as we approach peak Fed Funds rates around 5%. Now, instead of worrying what economic data may mean for the Fed, which appears set to gradually slow rate hikes over the next few months, traders will key in on what it means for underlying US economy and the potential for a recession in 2023.
In that vein, DJIA bulls would prefer to see strong economic data to support a continued rally to 35,000 or beyond in the index.
How to trade with City Index
You can trade with City Index by following these four easy steps:
- Open an account, or log in if you’re already a customer
• Open an account in the UK
• Open an account in Australia
• Open an account in Singapore
- Search for the market you want to trade in our award-winning platform
- Choose your position and size, and your stop and limit levels
- Place the trade
Related tags:
Latest market news




The complete CFD trading experience
Award-winning platforms, competitive spreads, low commissions and dedicated support.
We live and breathe the markets and are dedicated to helping traders realise their ambitions as we continue to set the industry bar.
Economic calendar
Web Trader platform
Our sophisticated web-based platform is packed with features.
Related articles
Gold outlook: XAU/USD hammered, stretched and vulnerable to a sharp rebound
Gold is getting hammered for solid fundamental reasons, but history suggests extreme four-hourly oversold conditions can produce violent countertrend rallies.
EUR/USD, USD/JPY Outlook: Oil, yields and an FX identity crisis
Crude oil is setting the tone across rates and FX, leaving EUR/USD vulnerable and USD/JPY caught between higher Treasury yields and the growing threat of intervention

Gold Dips Below Three-Month Uptrend, Bitcoin Pulls Back from Nine-Month High
Gold has dipped below its three-month uptrend, while Bitcoin has pulled back from a nine-month high as U.S. bond yields test levels last seen in 2004 and 2007. Risks build as Fed rate-hike expectations remain above 70%, while the Dollar Index holds near yearly highs.

StoneX Europe Ltd may make third party material available on this website which may contain information included but not limited to the conditions of financial markets. The material is for information purposes only and does not contain, and should not be construed as containing, investment advice and/or investment recommendation and/or an investment research and/or an offer of or solicitation for any transactions in financial instruments; any decision to enter into a specific transaction shall be made by the client following an assessment by him/her of their situation.
StoneX Europe Ltd makes no representation or warranty and assumes no liability as to the accuracy or completeness of the information provided, nor any loss arising from any investment based on a recommendation, forecast or other information supplied. You should always seek independent advice as to your suitability to speculate in any related markets and your ability to assume the associated risks, if you are at all unsure. We are not under any obligation to update any such material. Any opinion made may be personal to the author and may not reflect the opinion of StoneX Europe Ltd.