




Is Chinas A50 ready to bust higher
The China A50 Index is currently forming a flag pattern
Share this:
China’s economy has slowly been grinding higher. Unlike other countries, which faced a steep contraction of economic activity and then a quick spike in activity, China’s recovery has been moving slowly and steadily higher. Manufacturing PMI has been steady between 50.6 and 52.1 over the past year, however intense input and output price increases have dulled the data series lately. China’s inflation data is due out next week. Traders will be watching to see if CPI is able to uptick from April’s reading of 0.9%. Current expectations are for 1%. With the slow but steady growth, current low headline CPI data, and increased demand from abroad, one may think China’s stocks are flying. However, China is a having raw material input issues of its own, which may be holding stocks back. They are rising, but not soaring.
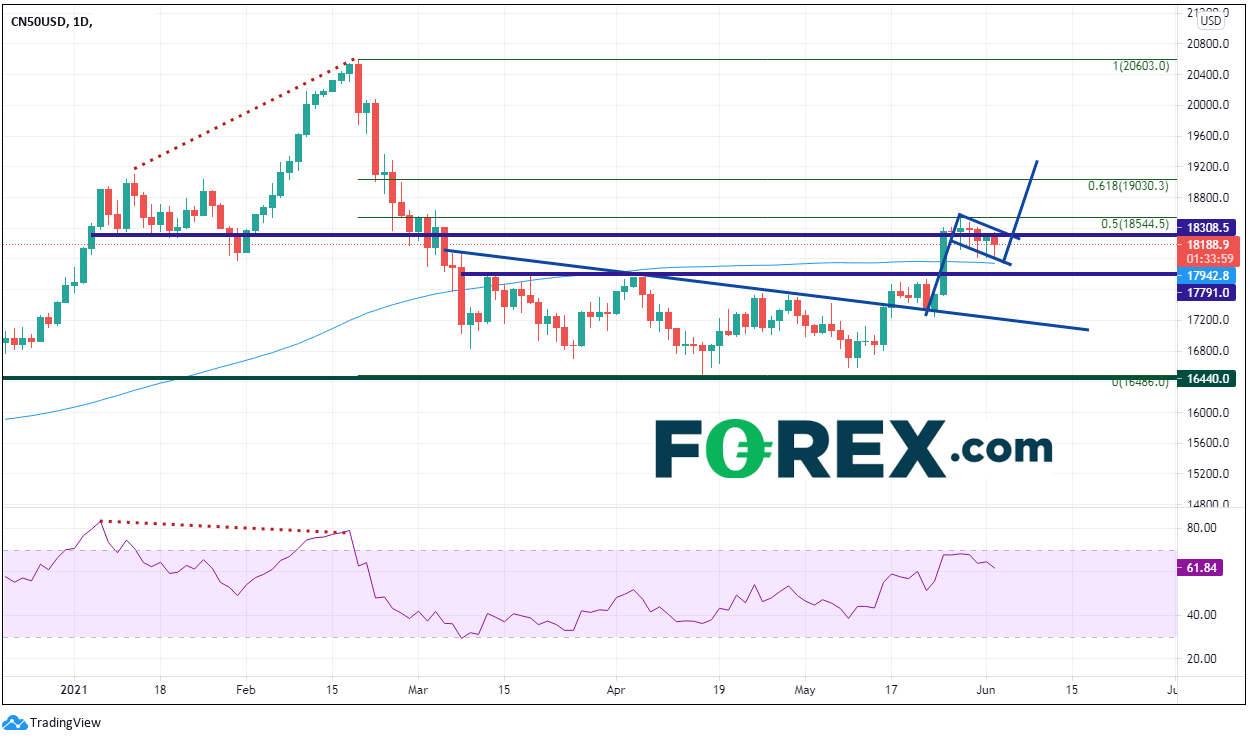
The China A50 Index gives investors access to the China domestic A shares. The main stock index grinded higher into mid-February of this year, near 20603, before pulling back as the RSI was in overbought territory and diverging from price. The A50 Index pulled back and held support at the spike high from July 6, 2021 (dark green line), near 16486. As price began to move higher, it broke above a downward sloping trendline from early March and is currently forming a flag pattern.
Source: Tradingview, City Index
Notice how price moved to the 50% retracement level from the February 18th highs to the April 15th lows, near 18544, before consolidating in its current pattern. The lower shadows on the candlesticks over the last 5 sessions indicate that although there was selling early in each day, buyers entered the market and took control each session towards the closes. The lows of the flag are holding support at the 100-day moving average just above 17943. If price breaks above 18400, it will break out of the top of the flag. The target of a flag pattern is the length of the flagpole added to the breakout point of the flag. In this case it’s near 19260. However, if price is to reach its target, it must first pass through the previously mentioned 50% retracement level at 18544 and the 61.8% Fibonacci retracement level from the same timeframe near 19030. In the event price can’t hold the 100 Day Moving Average at the bottom of the flag, horizontal support is just below at 17791, ahead of what would be a retest of the downward sloping trendline from early March, near 17200.
If China is to continue with its recovery and stock market indices are to continue to move higher, the China A50 Index must first break out of its flag formation. The target is near 19260. If price does reach the target, it may well continue its way to the February all-time highs!
Learn more about index trading opportunities.
China’s economy has slowly been grinding higher. Unlike other countries, which faced a steep contraction of economic activity and then a quick spike in activity, China’s recovery has been moving slowly and steadily higher. Manufacturing PMI has been steady between 50.6 and 52.1 over the past year, however intense input and output price increases have dulled the data series lately. China’s inflation data is due out next week. Traders will be watching to see if CPI is able to uptick from April’s reading of 0.9%. Current expectations are for 1%. With the slow but steady growth, current low headline CPI data, and increased demand from abroad, one may think China’s stocks are flying. However, China is a having raw material input issues of its own, which may be holding stocks back. They are rising, but not soaring.
The China A50 Index gives investors access to the China domestic A shares. The main stock index grinded higher into mid-February of this year, near 20603, before pulling back as the RSI was in overbought territory and diverging from price. The A50 Index pulled back and held support at the spike high from July 6, 2021 (dark green line), near 16486. As price began to move higher, it broke above a downward sloping trendline from early March and is currently forming a flag pattern.
Source: Tradingview, FOREX.com
Notice how price moved to the 50% retracement level from the February 18th highs to the April 15th lows, near 18544, before consolidating in its current pattern. The lower shadows on the candlesticks over the last 5 sessions indicate that although there was selling early in each day, buyers entered the market and took control each session towards the closes. The lows of the flag are holding support at the 100-day moving average just above 17943. If price breaks above 18400, it will break out of the top of the flag. The target of a flag pattern is the length of the flagpole added to the breakout point of the flag. In this case it’s near 19260. However, if price is to reach its target, it must first pass through the previously mentioned 50% retracement level at 18544 and the 61.8% Fibonacci retracement level from the same timeframe near 19030. In the event price can’t hold the 100 Day Moving Average at the bottom of the flag, horizontal support is just below at 17791, ahead of what would be a retest of the downward sloping trendline from early March, near 17200.
If China is to continue with its recovery and stock market indices are to continue to move higher, the China A50 Index must first break out of its flag formation. The target is near 19260. If price does reach the target, it may well continue its way to the February all-time highs!
Learn more about index trading opportunities.
Related tags:
Latest market news




The complete CFD trading experience
Award-winning platforms, competitive spreads, low commissions and dedicated support.
We live and breathe the markets and are dedicated to helping traders realise their ambitions as we continue to set the industry bar.
Economic calendar
Web Trader platform
Our sophisticated web-based platform is packed with features.
Related articles

China A50 resistance test looms as bonds flash expansion
Bond yields hint at recovery while economic data still lags. The A50 is testing a line in the sand that could set the tone for Chinese equities.

China A50 Outlook: PMI bounce and steady uptrend keep buyers in play
PMI strength adds weight to the bullish case for China A50, though official data keeps the rebound debate alive.

Crude oil, copper: Bullish China data offers relief for battered commodities
China’s services sector strengthened in May, boosting Chinese equity markets and providing some respite for commodities such as copper and WTI crude oil.
StoneX Europe Ltd may make third party material available on this website which may contain information included but not limited to the conditions of financial markets. The material is for information purposes only and does not contain, and should not be construed as containing, investment advice and/or investment recommendation and/or an investment research and/or an offer of or solicitation for any transactions in financial instruments; any decision to enter into a specific transaction shall be made by the client following an assessment by him/her of their situation.
StoneX Europe Ltd makes no representation or warranty and assumes no liability as to the accuracy or completeness of the information provided, nor any loss arising from any investment based on a recommendation, forecast or other information supplied. You should always seek independent advice as to your suitability to speculate in any related markets and your ability to assume the associated risks, if you are at all unsure. We are not under any obligation to update any such material. Any opinion made may be personal to the author and may not reflect the opinion of StoneX Europe Ltd.