



China A50 resistance test looms as bonds flash expansion
Bond yields hint at recovery while economic data still lags. The A50 is testing a line in the sand that could set the tone for Chinese equities.
Share this:

- A50 nearing December swing high at 14,409
- Breakout could target 15,000, 15,079, then 15,200
- Bond market curve steepening hints at possible economic recovery
China A50 Summary
Chinese equities have been on a tear, with indices like the A50 and Shanghai Composite charging higher as retail money shifts out of bonds and into stocks. Turnover has surged, the market cap of Shanghai and Shenzhen combined has punched through RMB 100 trillion for the first time, with the share prices of brokerages flying as trading volumes explode.

Source: TradingView
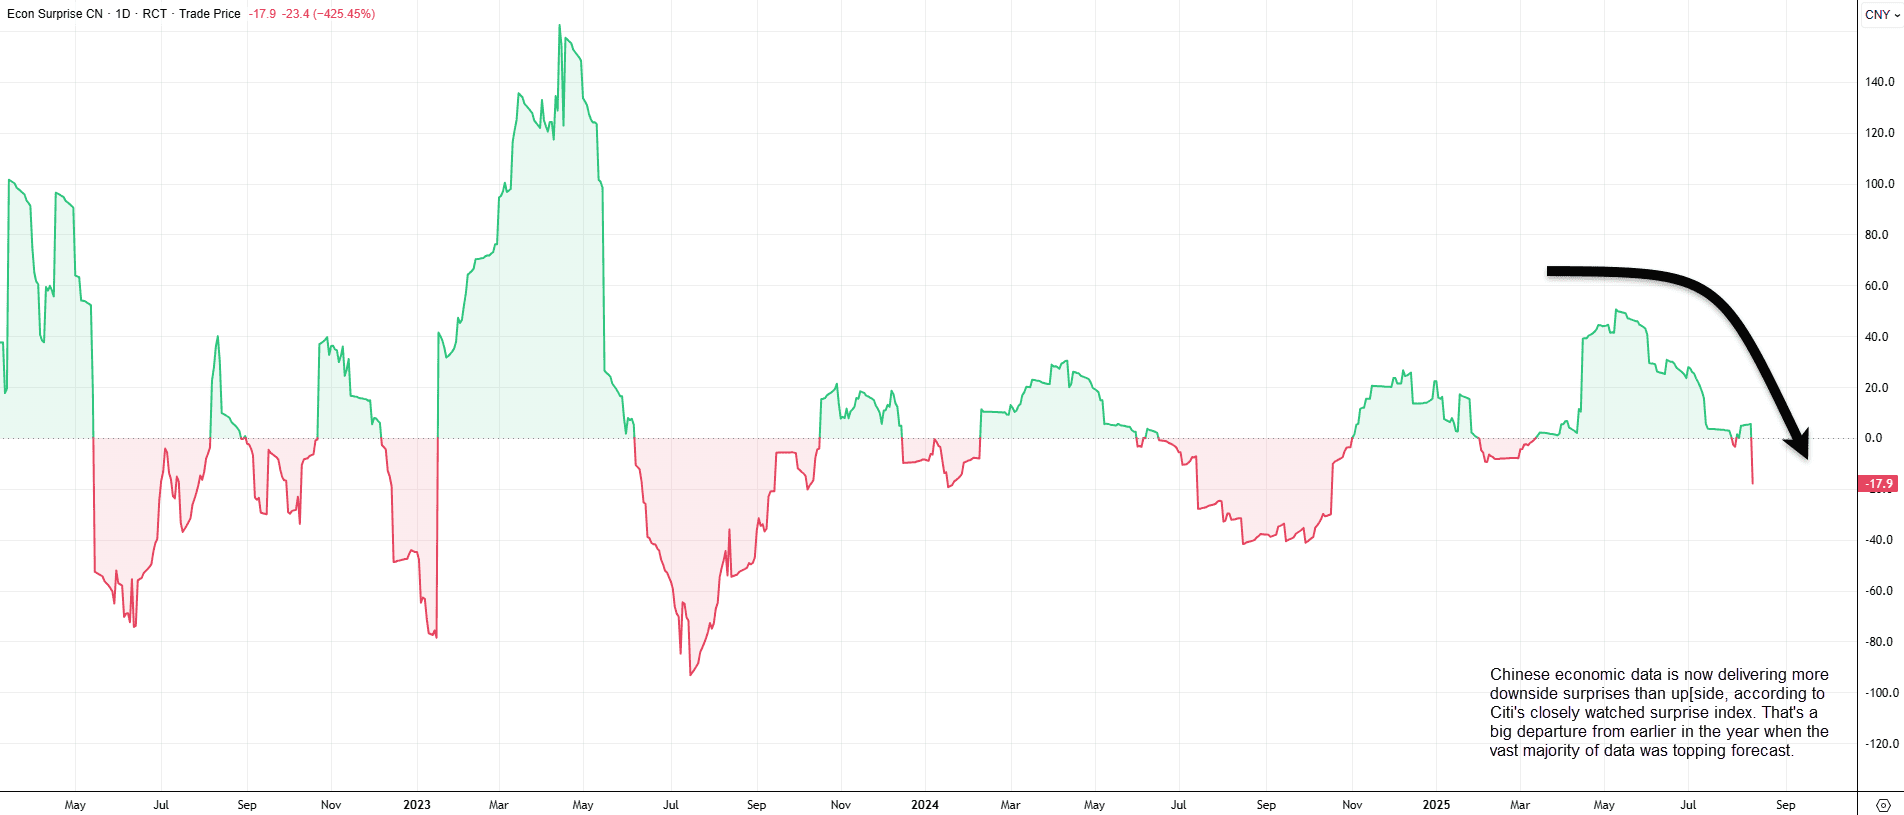
The story being told is one of local investors abandoning bonds, chasing higher returns in equities. Yet China’s sovereign curve has been bear steepening this year, with 2s10s and 5s30s moving sharply off cycle lows. That’s a pattern usually seen at the start of an economic upturn, not an economy undershooting on retail sales, industrial output, fixed asset investment, PMIs, and inflation.
Source: LSEG
Maybe bond investors are seeing something others aren’t. If the curve steepening does flag an approaching economic recovery, it could provide fundamental backing to the rally in Chinese stocks, including the biggest in the business in the bluechip A50 index.
China A50 Primer
The FTSE China A50 Index tracks the 50 largest companies listed on the Shanghai and Shenzhen exchanges, covering sectors like banks, insurers, energy firms, and tech. It’s widely used by global investors as a barometer of China’s stock market and is the underlying benchmark for popular futures contracts traded in Singapore. Because of that, the A50 often drives sentiment in offshore markets and is seen as a key gauge of Chinese equity performance.
A50 on Collision Course with December Highs

Source: TradingView
China’s A50 index appears to be on a collision course with the swing high set in December last year, motoring higher like so many other Chinese indices. If we see a clean break of the level, there’s very little technically standing in the way of a potential move back towards the blow-off highs set in October 2024.
14,409 is the level in question, with the current trajectory putting it on track to be tested as soon as Tuesday. Should we see a break and close above it, or at least a definitive bullish move, longs could be established with a stop beneath for protection.
15,000 screens as an initial target simply because it’s a round number, along with 15,079—the 23.6% fib of the September–October surge last year. Beyond that, 15,200 looks to be the last level of any significance before the October 2024 swing high of 16,322.
Of course, if the price cannot meaningfully clear 14,409, the setup could be flipped, with shorts set beneath the level with a stop above for protection. 14,185 and 13,700 screen as potential targets.
MACD and RSI (14) are both generating bullish momentum signals, favouring a bias to buy dips and topside breaks rather than selling rallies.
Related tags:
Latest market news




The complete CFD trading experience
Award-winning platforms, competitive spreads, low commissions and dedicated support.
We live and breathe the markets and are dedicated to helping traders realise their ambitions as we continue to set the industry bar.
Economic calendar
Web Trader platform
Our sophisticated web-based platform is packed with features.
Related articles
US Dollar Short-term Outlook: USD Rally on the Line as Midterms, NFP Loom 11 3 2026
DXY is testing pivotal support, with the weekly range breakout likely to determine the next major leg of the trend as key event risk unfolds.
Nasdaq 100 forecast: Stocks rebound but AI concerns linger
The Nasdaq 100 was finding some support at 28,000 after recent sell-off amid concerns about the AI trade. Even with oscillators oversold, the risk to the near-term forecast is tilted to the downside.

Silver outlook: a return to the 2011 high tests $49 to $50 support
Silver is testing key support at $49 to $50, the area of its 2011 high, and has yet to bounce. A bullish reversal candlestick would make the picture more constructive, but for now the near-term forecast hangs in the balance.
StoneX Europe Ltd may make third party material available on this website which may contain information included but not limited to the conditions of financial markets. The material is for information purposes only and does not contain, and should not be construed as containing, investment advice and/or investment recommendation and/or an investment research and/or an offer of or solicitation for any transactions in financial instruments; any decision to enter into a specific transaction shall be made by the client following an assessment by him/her of their situation.
StoneX Europe Ltd makes no representation or warranty and assumes no liability as to the accuracy or completeness of the information provided, nor any loss arising from any investment based on a recommendation, forecast or other information supplied. You should always seek independent advice as to your suitability to speculate in any related markets and your ability to assume the associated risks, if you are at all unsure. We are not under any obligation to update any such material. Any opinion made may be personal to the author and may not reflect the opinion of StoneX Europe Ltd.