



Is USD/CNH set for a multi-month rally?
If current (and expected) yield differentials are anything to go by, the yuan looks quite overvalued. Especially in the context of ongoing growth concerns and geopolitical risks.
Share this:

The Chinese yuan hit its lowest point in 3-month yesterday and volatility has been on the rise, which is noteworthy given it is a tightly controlled currency. And there have been a few driving factors behind its recent appreciation. Growth concerns which stem from Beijing’s ‘common prosperity’ at the expense of Western profits is a theme which has been present for some time. But the PBOC’s surprise decision to not cut rates further this week saw their fall, and PBOC set their reference rate below market expectations for two consecutive days. And there's also been a significant rise in covid cases resulting in lockdowns for millions of people.


And this has seen offshore yuan (CNH) traders lower than the onshore yuan (CNY) to suggest traders think further depreciation is on the cards – at least over the near-term. Furthermore, the gap between onshore and offshore was its widest in in 9-months earlier this week.
But China is also getting dragged into Russia’s geopolitical warfare, which is further weighing on growth concerns as it raises the prospects of Western sanctions aimed at China, alongside the cost of supplying military aid. But it is also worth noting that the yuan is not just rising against the dollar, as the CNY reference rate has increased against all currencies (on aggregate) over the previous 3-months.
Read our guide on the PBOC (People's Bank of China) and inflation
Read our guide on the PBOC (People's Bank of China) and inflation
Have we seen a major inflection point on the yuan?
The following chart raises a couple of key point, which leans towards the potential of a multi-month rally on USD/CNH. Firstly, back in 2015 that the PBOC (People’s Bank of China) devalued the yuan which saw USD/CNH burst above 6.3 as part of its 4-year rally. In 2018 (amidst a trade war during Trump’s presidency) USD/CNH pulled back to 6.3 and, after several volatile months around that key level, rallied aggressively higher as the yuan was devalued once again.
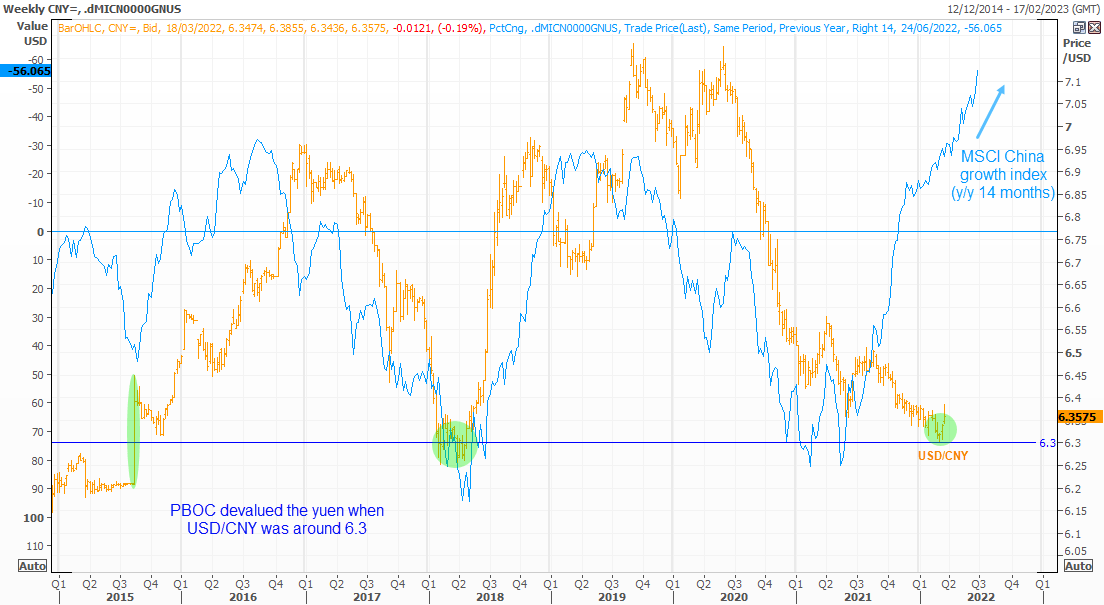

But notice how this time around, momentum has been very slow as USD/CNH gradually crept it way towards (but not quite to) 6.3, before rallying from that key level. On a sidenote, it is interesting that this rally began just after the Russian ruble collapsed and the West implemented harsh sanctions on Russian oligarchs and selected banks.
And this brings us to our second point. MSCI’s China growth index shares an interesting (inverted) correlation with USD/CNH. Using MSCI’s own description, the index “captures large and mid-cap securities exhibiting overall growth style characteristics across the Chinese equity markets”.
Yield differentials point towards upside potential for USD/CNH
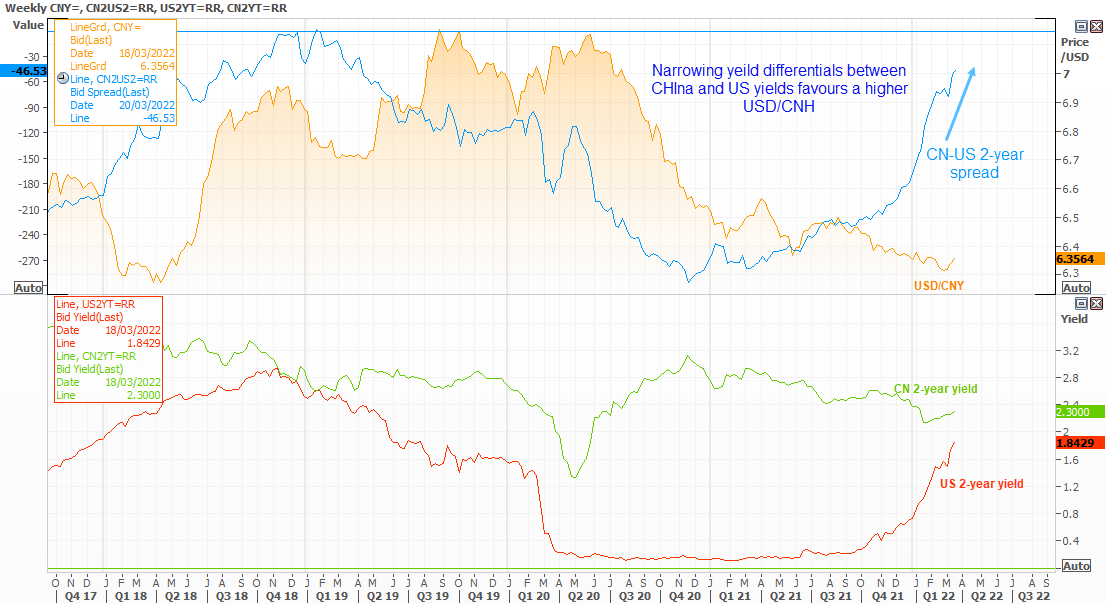

The blue line is a y/y % change of the MSCI China growth index (CGI) and shifted forward 3-months as it is supposedly a leading indicator for USD/CNY. The CGI troughed in the first half of 2021 and has continued to accelerate higher ahead of USD/CNY. Given that the Fed are now on an aggressive rate-hike cycle, and the CN-US 2-year yield has narrowed to its narrowest level since February 2021, we think there is reason to expect a higher USD/CNY going forward.
USD/CNH pulls back ahead of FOMC meeting
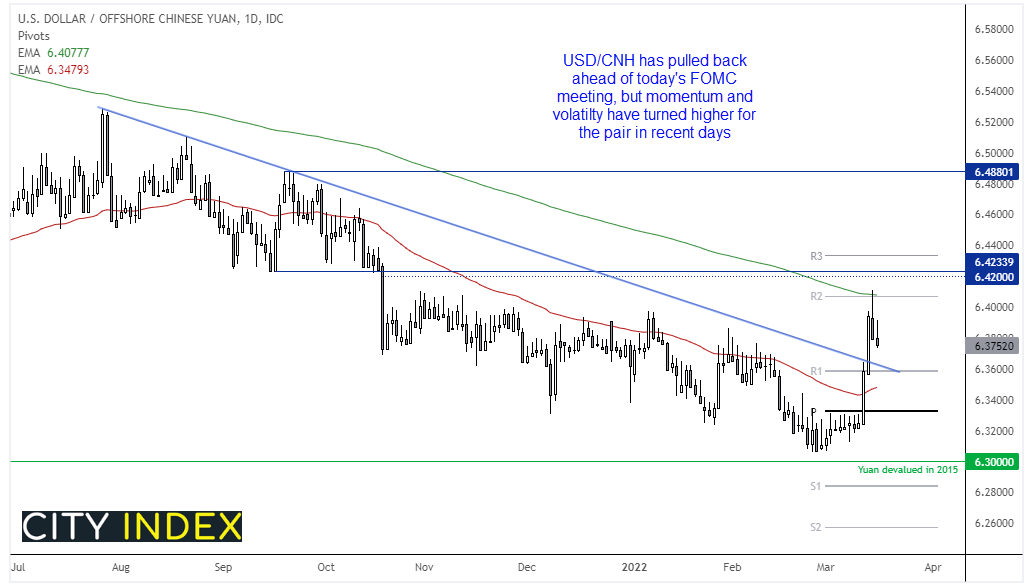
It’s 3-day rally peaked out yesterday after probing the 200-day eMA and monthly R2 pivot. Prices have since pulled back and trade in a tight range ahead of today’s FOC meeting, where the Fed are widely expected to raise rates by 25 bps. Should they disappoint with a slightly dovish / cautious hike then we’d expect USD/CNH to pull back further, in which case we’d look for evidence of support / higher low for future long setups.
Related tags:
Latest market news




The complete CFD trading experience
Award-winning platforms, competitive spreads, low commissions and dedicated support.
We live and breathe the markets and are dedicated to helping traders realise their ambitions as we continue to set the industry bar.
Economic calendar
Web Trader platform
Our sophisticated web-based platform is packed with features.
Related articles
EUR/USD weekly outlook: Oil, inflation and NFP in focus
After coming under significant pressure in recent weeks, the EUR/USD came off its lows to finish the week on a positive note on Friday, albeit with only a mild rebound. That was not enough to prevent the exchange rate falling for the third consecutive week, as the US dollar and bond yields rallied across the board.

Gold Q4 2026 outlook: Resilience in the face of rallying dollar and yields
As we headed towards the latter stages of Q3 and into Q4, the Fed had just hiked rates in a hawkish FOMC meeting, while the likes of the ECB and BoJ had also tightened their respective policies. Oil prices remained elevated amid the prolonged US-Iran conflict. Meanwhile, bond yields were breaking out, and the dollar was higher across the board. Yet, remarkably, gold was still holding in the positive territory for the third quarter, even if it had weakened somewhat in September.

Oil Quietly Hands the Fed a Reason to Stay Hawkish
Oil prices and the U.S. dollar are both on the front foot as elevated energy costs feed Fed warnings that inflation may prove sticky.
StoneX Europe Ltd may make third party material available on this website which may contain information included but not limited to the conditions of financial markets. The material is for information purposes only and does not contain, and should not be construed as containing, investment advice and/or investment recommendation and/or an investment research and/or an offer of or solicitation for any transactions in financial instruments; any decision to enter into a specific transaction shall be made by the client following an assessment by him/her of their situation.
StoneX Europe Ltd makes no representation or warranty and assumes no liability as to the accuracy or completeness of the information provided, nor any loss arising from any investment based on a recommendation, forecast or other information supplied. You should always seek independent advice as to your suitability to speculate in any related markets and your ability to assume the associated risks, if you are at all unsure. We are not under any obligation to update any such material. Any opinion made may be personal to the author and may not reflect the opinion of StoneX Europe Ltd.