





Mixed manufacturing data and Powell testimony provides little to help traders
Watch employment data and wages to help determine time frame for Fed tapering
Share this:

An odd mix of readings of US manufacturing data was released earlier today. The NY Empire State Manufacturing Index for July was 43 vs 18 expected and 17.4 in July. Compare that to the Fed Manufacturing Index for the city at the opposite of the New Jersey turnpike, Philadelphia, and it paints a different picture. The reading was 21.9 for July vs 29 expected and 30.7 in June. The New York manufacturing index was the highest on record, with all components stronger except for delivery times. However, the Philly Fed manufacturing index dropped for the 4th consecutive month to its lowest reading since December 2020. The prices paid component fell to 69.7 vs 80.7 in June. The geographic areas are so close, yet the divergence between the two prints couldn’t be farther apart!
That raises the question: Which index is likely to continue with its current trend? Other data released today shows that both import and export prices decreased for June. In addition, Industrial Production for June was 0.4% MoM vs 0.7% MoM for May and Manufacturing Production for June was -0.1% MoM vs 0.9% MoM in May. Based on this data, along with Powell’s extreme dovishness, it seems that the Philadelphia Fed Manufacturing Index may be leading the NY Empire State Manufacturing Index and that the latter index may turn lower soon.
Everything you need to know about the Federal Reserve
The DXY was unfazed by the data, choosing to focus on the befuddling testimony of Fed Chairman Powell, in which he continued to emphasize that current inflation is transitory. He was extremely dovish, leaving traders more confused than before as to the timing of the announcement of any tapering decisions. Traders may want to trade the ranges in the DXY until price breaks though either side. The bottom trendline of the range crosses near 92.15. Horizontal support below there from the June 23 lows is at 91.51. Resistance is at the top trendline near 92.83, then the highs from March 31st at 93.40.
Source: Tradingview, City Index
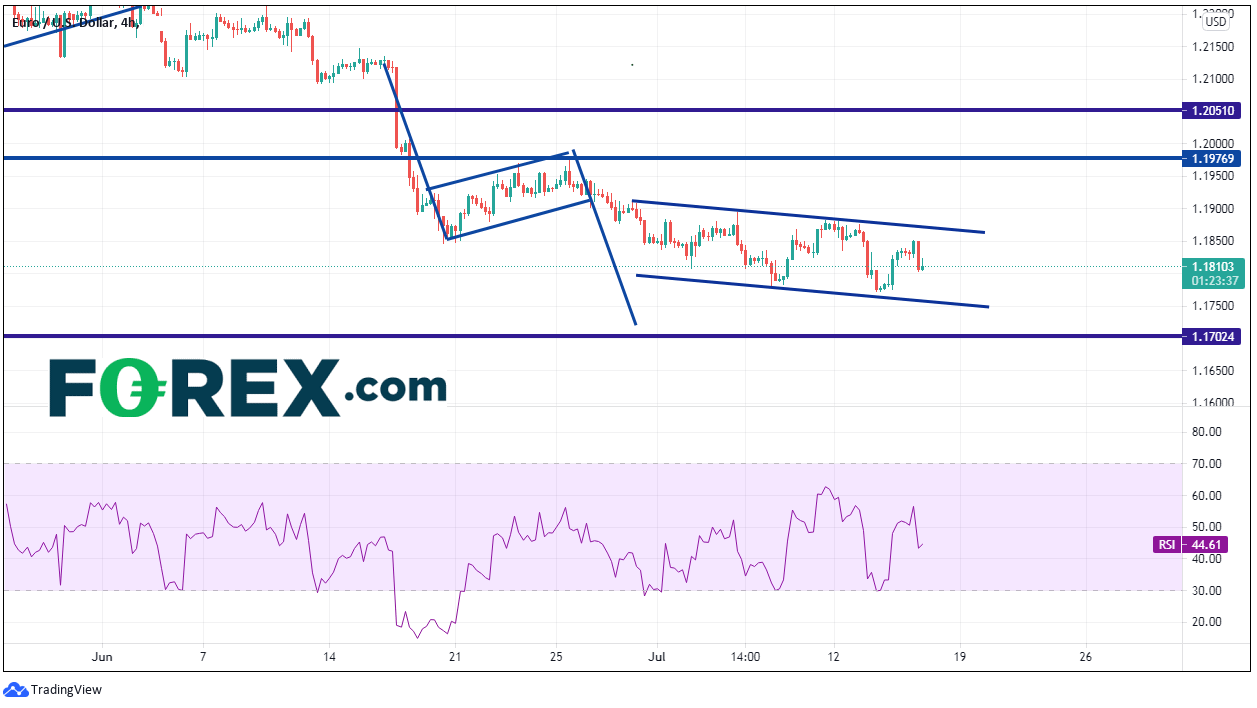
Traders could also look to range trade the EUR/USD, which has similar but opposite characteristics as the DXY. The bottom trendline is near 1.1750, with the March 31st lows below at 1.1702. Resistance is at the top end of the range, near 1.1870, followed by horizontal resistance from the highs on June 25th near 1.1975.
Source: Tradingview, City Index
One thing that seems to stand out after Powell’s testimony is that inflation won’t be a major contributor in the Fed’s decision as to when they should announce that they will begin tapering. More specifically, watch employment data and wages.
Learn more about forex trading opportunities.
An odd mix of readings of US manufacturing data was released earlier today. The NY Empire State Manufacturing Index for July was 43 vs 18 expected and 17.4 in July. Compare that to the Fed Manufacturing Index for the city at the opposite of the New Jersey turnpike, Philadelphia, and it paints a different picture. The reading was 21.9 for July vs 29 expected and 30.7 in June. The New York manufacturing index was the highest on record, with all components stronger except for delivery times. However, the Philly Fed manufacturing index dropped for the 4th consecutive month to its lowest reading since December 2020. The prices paid component fell to 69.7 vs 80.7 in June. The geographic areas are so close, yet the divergence between the two prints couldn’t be farther apart!
That raises the question: Which index is likely to continue with its current trend? Other data released today shows that both import and export prices decreased for June. In addition, Industrial Production for June was 0.4% MoM vs 0.7% MoM for May and Manufacturing Production for June was -0.1% MoM vs 0.9% MoM in May. Based on this data, along with Powell’s extreme dovishness, it seems that the Philadelphia Fed Manufacturing Index may be leading the NY Empire State Manufacturing Index and that the latter index may turn lower soon.
The DXY was unfazed by the data, choosing to focus on the befuddling testimony of Fed Chairman Powell, in which he continued to emphasize that current inflation is transitory. He was extremely dovish, leaving traders more confused than before as to the timing of the announcement of any tapering decisions. Traders may want to trade the ranges in the DXY until price breaks though either side. The bottom trendline of the range crosses near 92.15. Horizontal support below there from the June 23 lows is at 91.51. Resistance is at the top trendline near 92.83, then the highs from March 31st at 93.40.
Source: Tradingview, FOREX.com
Traders could also look to range trade the EUR/USD, which has similar but opposite characteristics as the DXY. The bottom trendline is near 1.1750, with the March 31st lows below at 1.1702. Resistance is at the top end of the range, near 1.1870, followed by horizontal resistance from the highs on June 25th near 1.1975.
Source: Tradingview, FOREX.com
One thing that seems to stand out after Powell’s testimony is that inflation won’t be a major contributor in the Fed’s decision as to when they should announce that they will begin tapering. More specifically, watch employment data and wages.
Learn more about forex trading opportunities.
Related tags:
Latest market news




The complete CFD trading experience
Award-winning platforms, competitive spreads, low commissions and dedicated support.
We live and breathe the markets and are dedicated to helping traders realise their ambitions as we continue to set the industry bar.
Economic calendar
Web Trader platform
Our sophisticated web-based platform is packed with features.
Related articles
USD/JPY Q4 2026 Outlook: Hawkish Fed Pricing Clashes With Intervention Risk
The year-end tug-of-war is clear: hawkish Fed pricing supports USD/JPY, while intervention risk limits the upside.
Japanese Yen Forecast: USD/JPY 4% Rally Challenges Post-Intervention Downtrend 9 24 2026
USD/JPY momentum has shifted sharply higher, putting a major resistance confluence in focus as U.S. and Japanese event risk builds.


Oil Quietly Hands the Fed a Reason to Stay Hawkish
Oil prices and the U.S. dollar are both on the front foot as elevated energy costs feed Fed warnings that inflation may prove sticky.

StoneX Europe Ltd may make third party material available on this website which may contain information included but not limited to the conditions of financial markets. The material is for information purposes only and does not contain, and should not be construed as containing, investment advice and/or investment recommendation and/or an investment research and/or an offer of or solicitation for any transactions in financial instruments; any decision to enter into a specific transaction shall be made by the client following an assessment by him/her of their situation.
StoneX Europe Ltd makes no representation or warranty and assumes no liability as to the accuracy or completeness of the information provided, nor any loss arising from any investment based on a recommendation, forecast or other information supplied. You should always seek independent advice as to your suitability to speculate in any related markets and your ability to assume the associated risks, if you are at all unsure. We are not under any obligation to update any such material. Any opinion made may be personal to the author and may not reflect the opinion of StoneX Europe Ltd.