



Nasdaq 100 analysis: Short-covering boost for stocks in tumultuous week
Stocks bounced back in the first half of Friday’s session as yields dipped and the dollar eased. But it is far too early to say the markets have bottomed, as fundamentally nothing has changed. Today’s recovery looks like is driven by profit-taking more than anything, as bonds, indices and major currencies tested some key levels.
Share this:

- Nasdaq 100 analysis: Stocks take breather as bond yields ease
- Tech Stocks remain vulnerable amid high yields, rising crude oil
- Nasdaq 100 technical analysis point further lower
Before discussing the macro factors in greater detail, here's a video highlighting the key events and levels to watch on the Nasdaq 100, as well as the DAX, GBP/USD and EUR/USD:
Stocks bounced back in the first half of Friday’s session as yields dipped and the dollar eased. But it is far too early to say the markets have bottomed, as fundamentally nothing has changed. Today’s recovery looks like is driven by profit-taking more than anything, as bonds, indices and major currencies tested some key levels. For example, the US 10-year yields hit 4.500% before falling. If we are correct about our assumption that the recovery in risk assets is driven merely by position squaring, then expect to see continued volatility in the week ahead. In fact, we wouldn’t be surprised if US indices were to give up their gains later in the day.
It has been a bad week for US stock markets with major indices falling sharply ever since the Fed delivered that hawkish interest rate pause on Wednesday. That decision saw bond yields break further higher, which weighed heavily on risk appetite.
Nasdaq 100 analysis: Stocks could fall further amid rising yields, crude oil
Investors are obviously very concerned about inflation and the path of interest rates amid the latest crude oil rally and in light of the Fed’s warning that rates are not going to come down soon. With the potential for oil prices to stay elevated or push even higher, this is raising concerns over inflation again.
But apart from the fact that the Fed is hawkish, and interest rates are obviously high, is there something else that is keeping bond yields elevated? Are investors simply very confident about economic growth that they are buying record amounts of US debt? Or are the high yields a reflection of investors growing worried about something much bigger, like the ballooning US debt levels? If so, it makes sense to demand a higher rate of return for parking their funds in the so-called “risk-free” asset – especially when you consider that the government will need to keep borrowing and paying higher interest rate to do and costing it more to service it debt. Issuing more and more debt might be the only solution…which is not sustainable.
So, there is a big risk that yields could remain high for longer, which could be bad news for some longer-duration equities, those that are expected to produce their highest cash flows in the future. Many of such companies are dominated in the technology sector, putting the tech-heavy Nasdaq 100 into focus.
Nasdaq 100 technical analysis
Source: TradingView.com
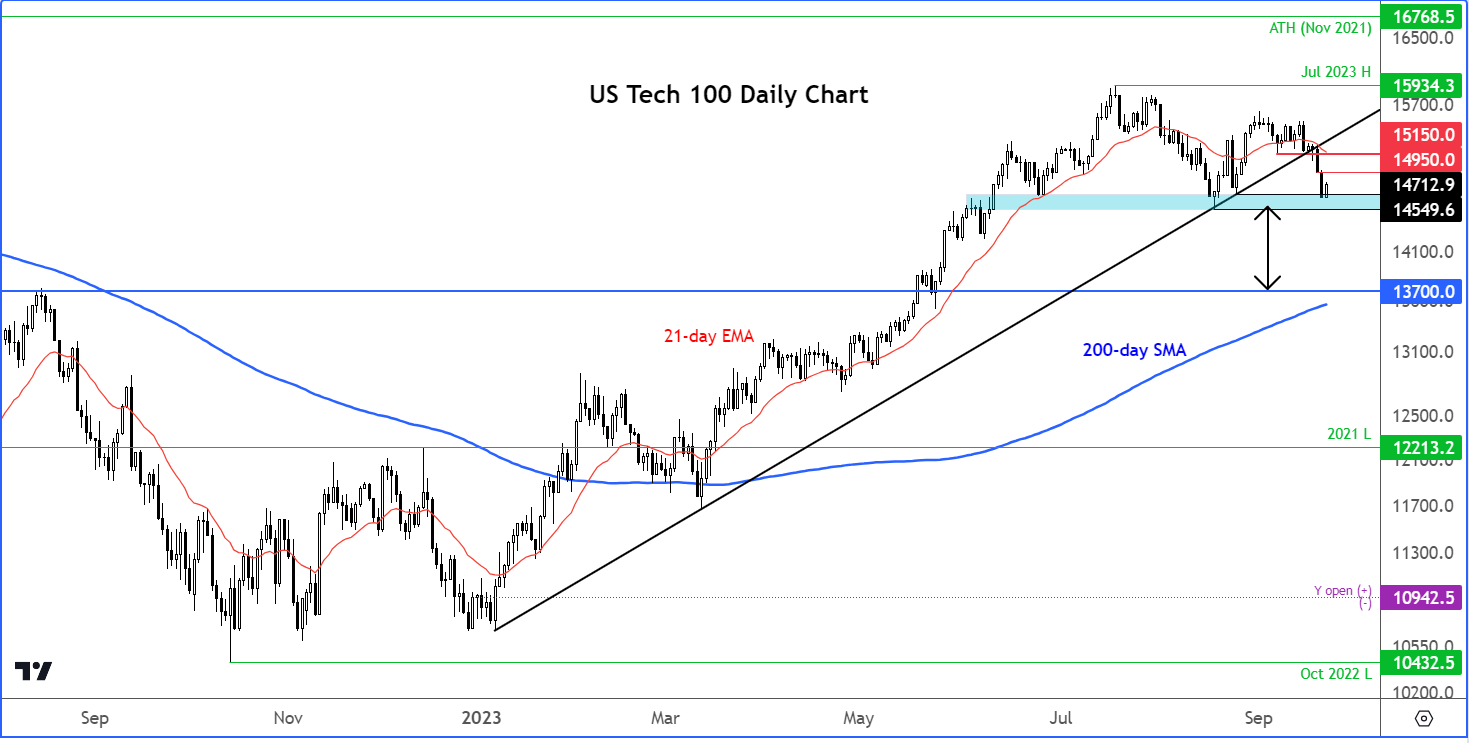
The Nasdaq 100 broke its bullish trend line and we have seen some downside follow-through in recent days, before pausing today for a breather as the shorts covered their positions. But there could be more downside to come in the days ahead, given the technical damage that has been incurred and not to mention valuation concerns and other macro risks. So, on balance, the path of least resistance is still to the downside.
For now, the Nasdaq has managed to hold its own above key support zone in the region between 14550 to 14700ish (see shaded region on the chart). This is the neckline of the head and shoulders pattern that has been formed in recent weeks. We expect this area to break soon.
If and when the above-mentioned support zone breaks, traders will then need to watch what happens next.
A clean break and desire to hold below that area could set the stage for a much bigger correction, perhaps all the way towards long-term support around 13700.
However, if we see a false break below the neckline of the H&S pattern, then this could set up the next leg of the rally as the market once again disappoint the bears despite all the macro risks.
For now, let’s take it from one level to the next and not get carried away.
-- Written by Fawad Razaqzada, Market Analyst
Follow Fawad on Twitter @Trader_F_R
How to trade with City Index
You can trade with City Index by following these four easy steps:
- Open an account, or log in if you’re already a customer
• Open an account in the UK
• Open an account in Australia
• Open an account in Singapore
- Search for the company you want to trade in our award-winning platform
- Choose your position and size, and your stop and limit levels
- Place the trade
Related tags:
Latest market news




The complete CFD trading experience
Award-winning platforms, competitive spreads, low commissions and dedicated support.
We live and breathe the markets and are dedicated to helping traders realise their ambitions as we continue to set the industry bar.
Economic calendar
Web Trader platform
Our sophisticated web-based platform is packed with features.
Related articles
Gold Outlook: XAU/USD hit hard as US yields, dollar resume ascent
A stronger dollar, surging front-end yields and renewed geopolitical tension have combined to push gold back towards key technical support.
EUR/USD weekly outlook: Oil, inflation and NFP in focus
After coming under significant pressure in recent weeks, the EUR/USD came off its lows to finish the week on a positive note on Friday, albeit with only a mild rebound. That was not enough to prevent the exchange rate falling for the third consecutive week, as the US dollar and bond yields rallied across the board.
Gold Q4 2026 outlook: Resilience in the face of rallying dollar and yields
As we headed towards the latter stages of Q3 and into Q4, the Fed had just hiked rates in a hawkish FOMC meeting, while the likes of the ECB and BoJ had also tightened their respective policies. Oil prices remained elevated amid the prolonged US-Iran conflict. Meanwhile, bond yields were breaking out, and the dollar was higher across the board. Yet, remarkably, gold was still holding in the positive territory for the third quarter, even if it had weakened somewhat in September.
StoneX Europe Ltd may make third party material available on this website which may contain information included but not limited to the conditions of financial markets. The material is for information purposes only and does not contain, and should not be construed as containing, investment advice and/or investment recommendation and/or an investment research and/or an offer of or solicitation for any transactions in financial instruments; any decision to enter into a specific transaction shall be made by the client following an assessment by him/her of their situation.
StoneX Europe Ltd makes no representation or warranty and assumes no liability as to the accuracy or completeness of the information provided, nor any loss arising from any investment based on a recommendation, forecast or other information supplied. You should always seek independent advice as to your suitability to speculate in any related markets and your ability to assume the associated risks, if you are at all unsure. We are not under any obligation to update any such material. Any opinion made may be personal to the author and may not reflect the opinion of StoneX Europe Ltd.